Periodically, you may wish to analyze the average number of times users take a specific action over time. The value of this kind of insight is to understand whether it’s your per-user engagement that’s increasing or just your overall count of users.
To set this up in Heap, complete the following steps:
1. Navigate to Analyze > Usage over time chart (this may be hidden behind the More Options … menu)
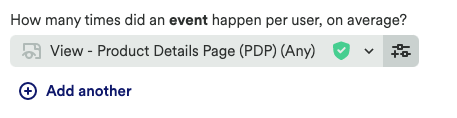
2. Select Average per user
3. In the top field, select the event you’d like to see this average for. For example, if you run an online shop, you may want to see the average number of product page views per user.
4. Click View results. This will generate a chart like this:
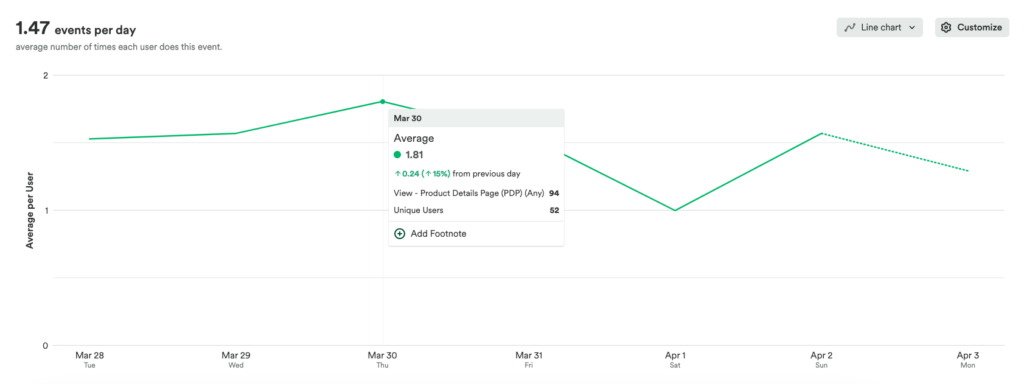
Because this chart adjusts for average count per user, it tells us more about per-user engagement (and whether it’s going up) than a total count of the events or users alone would.
For more information about our usage over time chart type, see our Usage over time analysis overview.
To set up a Heap Connect query equivalent to this chart, see Average Sessions per User.