Your aha moment is a metric that happens early on, is done quickly, and which shows that users are starting to get value out of your tool.
A few examples to help guide you:
- Adding 7 friends in 10 days on Facebook
- Following 30 users in 7 days on Twitter
- Getting your question answered in Quora
This will be different in every product, so it’s important to figure out what yours is so you can monitor it in Heap.
You can work towards understanding yours with a retention chart. To set this up in Heap, complete the following steps:
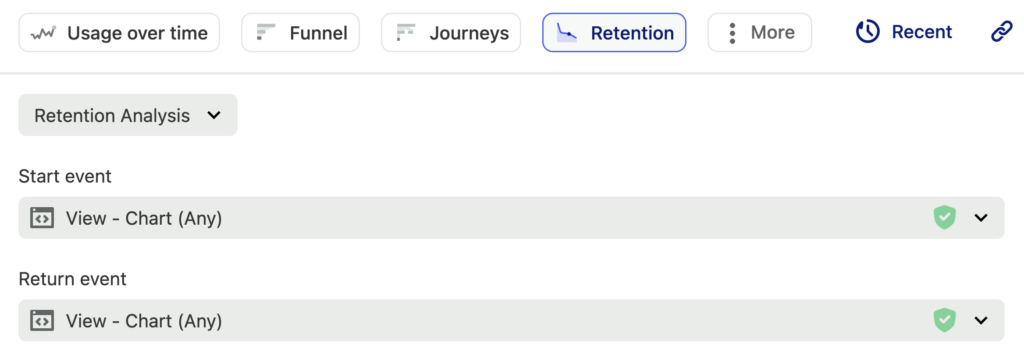
1. Navigate to Analyze > Retention and ensure Retention Analysis is selected in the first drop-down
2. Select the two events you’d like to use to analyze engagement behavior
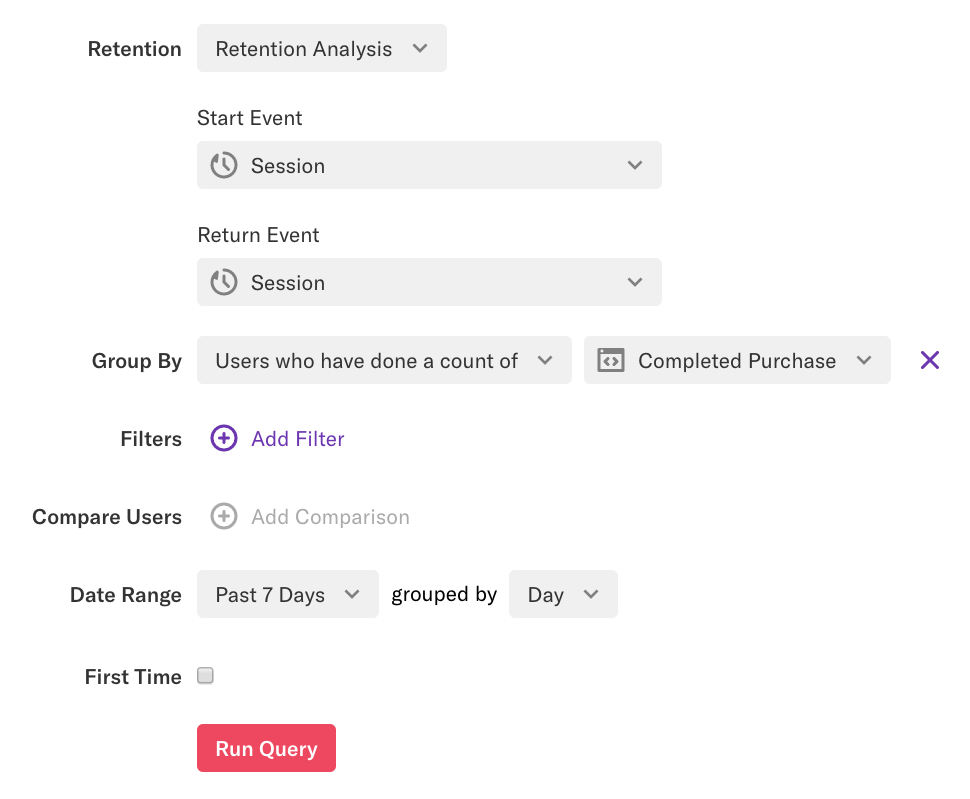
As an example in Heap, we may want to see how often users view a chart (just like you’re doing right now!)
3. Group by Users who have done a count of this event
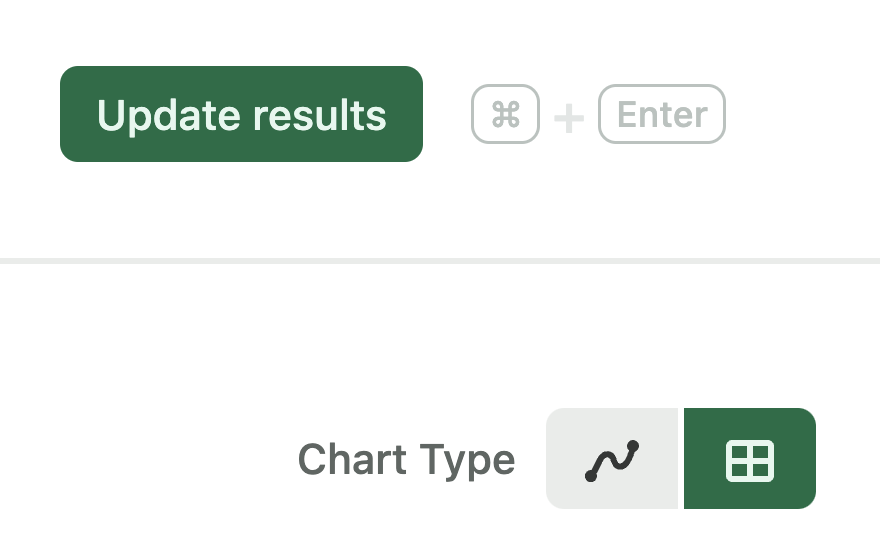
4. Click View results to generate a line chart of results
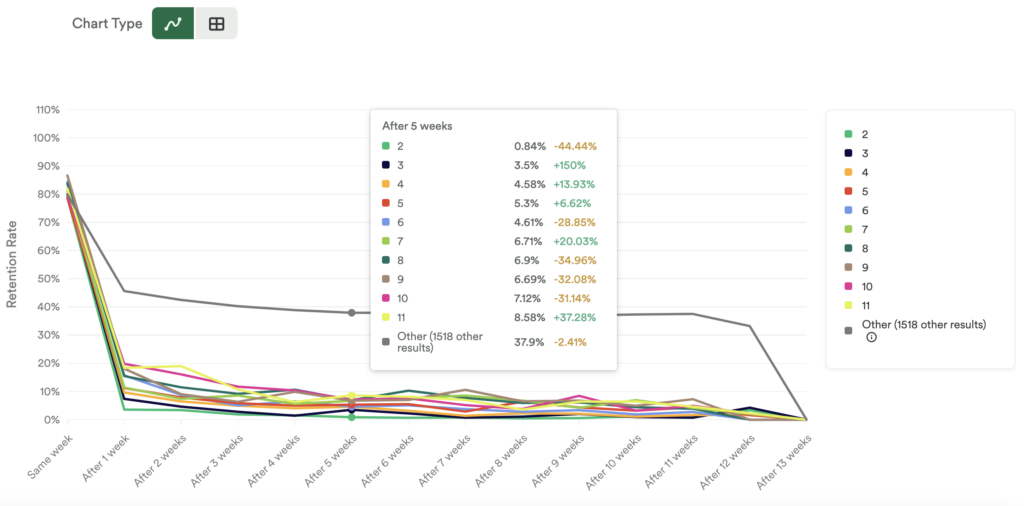
Optional: Use the Chart Type switcher to switch to a table chart if this view is preferable
Reviewing the retention chart results, we see that users who have viewed charts more than 9 times per week have higher retention than users who have viewed charts at other intervals. Thus, we may set a data-driven precedent that someone is more likely to be an avid user of the Heap if they view a chart more than 9 times, and use this to set our KPIs.
Once you identify the magic number for your aha moment, you can focus your efforts to get users to the point through marketing campaigns, changes in product education, and changes in your UX. For more info on how to do this, check out our guide on optimizing the activation funnel.