Just as how usage over time charts and funnels count things differently, they also group results differently because they are measuring different things.
If a single user has completed an event multiple times, that user will be grouped into multiple different buckets in a usage over time chart. However, when the same user or event is analyzed in a funnel, Heap will only represent that unique user once, so it will be included in the bucket that occurred closest in time to the subsequent funnel event.
As an example in Heap, we’ll chart how many unique users clicked the Define Event button grouped by which page in Heap they were on when they clicked it.
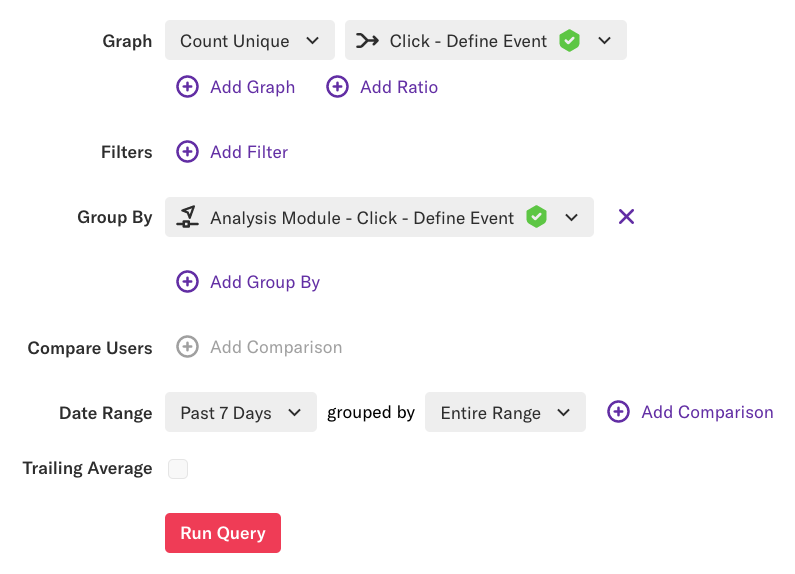
The results for this query give us a total of 915 unique users bucketed into groups based on which page they were on when they clicked the button.
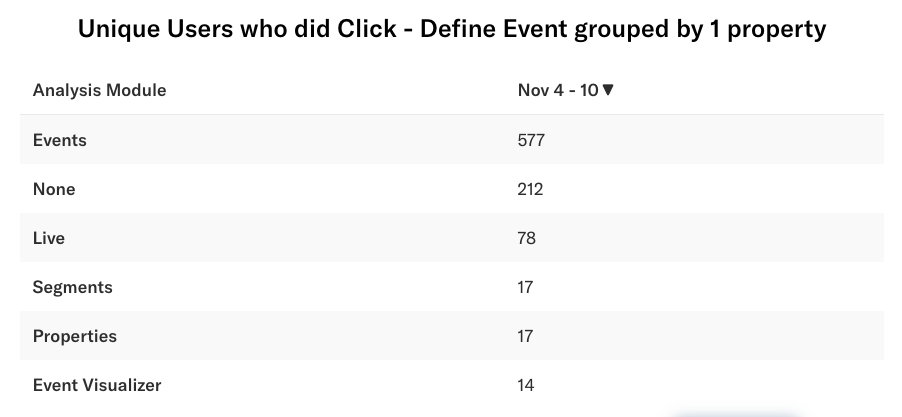
The same unique user can have clicked that button on multiple different pages, and thus, they will appear in multiple categories.
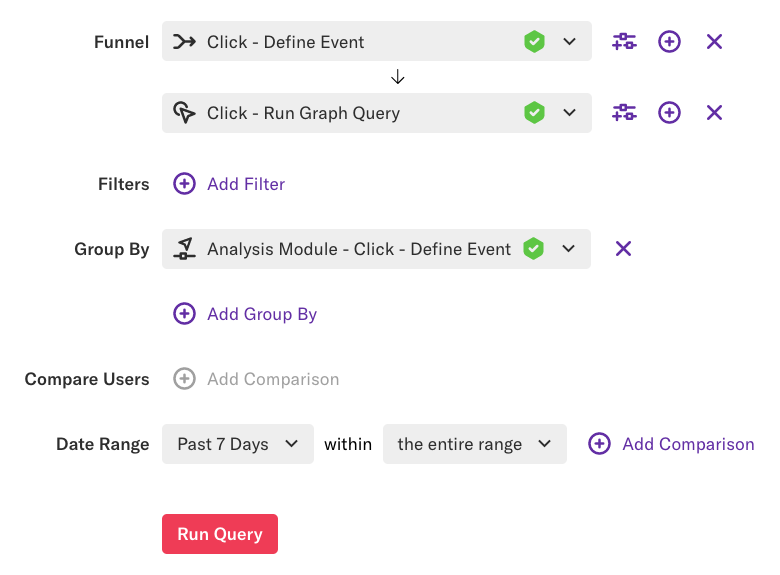
In comparison, let’s set up a funnel for users who clicked the Define Event and then went on to click View results.
The results give us different, lower totals from the usage over time chart. This is because each unique user is only represented once, and is only included in the bucket that occurred closest in time to the subsequent funnel event.
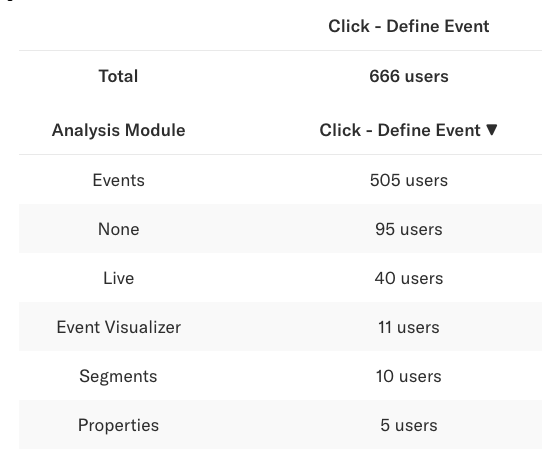
For example, a user who may have clicked the Define Event button from the Events, Live, and visual labeling page over the past week would be counted in all three of those buckets in the usage over time chart. That same user would only be counted in one of those buckets in the funnel, thus lowering the count.
For more information about funnel analysis, see our Funnel analysis overview guide.
For more information about usage over time chart, see our Usage over time overview guide.