Skip to content
  • Home
  • Developers
  • API
  • Releases
  • Community
  • University
  • Status
  • Home
  • Developers
  • API
  • Releases
  • Community
  • University
  • Status
Home Charts Graph Chart FAQs How do I customize the range of values of the x-axis or y-axis in a graph?
Session Replay Getting Started Administration Data Management Definitions Charts Analysis Examples Heap Plays Integrations Heap Connect Data Privacy

Table of Contents

Was this article helpful?

Yes No

Thank you for your feedback!

How do I customize the range of values of the x-axis or y-axis in a graph?

This feature is only available to customers on paid plans. To upgrade, contact your Customer Success Manager or sales@heap.io.
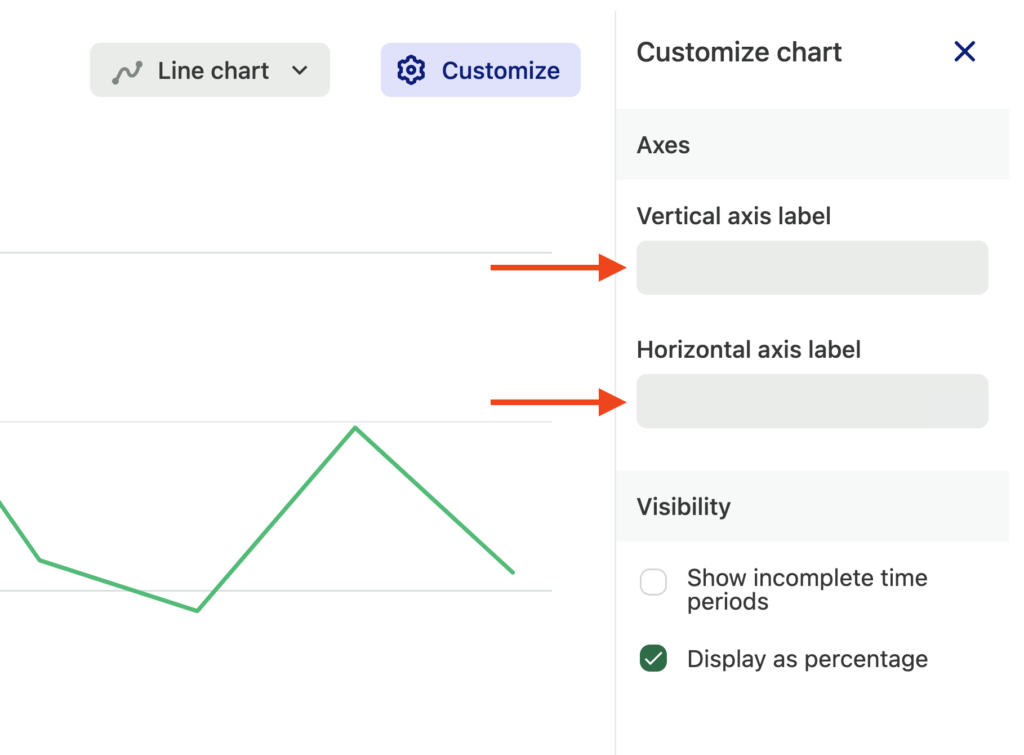
Click Customize next to your graph results to open a modal where you can type in new axes labels. You should see them render immediately as you type.

For more information about graph analysis, see our Graph analysis overview guide.

Was this article helpful?

Yes No

Thank you for your feedback!

Last updated March 9, 2023.

graph analysis

Related Articles

  • What is Heap and how do I get an account?
  • Autocaptured Data
  • Understanding Heap’s Data Model
  • Blog
  • Partners
  • Legal
  • Security
  • Terms
  • About
  • Careers
  • Privacy
  • Contact Us

© 2023 Heap, Inc.