To make the most of this guide, you’ll need a baseline understanding of key concepts like events, charts, and properties. If you are still learning about Heap (meaning those terms don’t mean anything to you), we recommend taking our Hello Heap course or reviewing our Setting Up Heap guide prior to jumping into this guide.
This guide is meant to be used in tandem with one of Heap’s in-app Dashboard templates (linked in step 0). We recommend having the template and this guide open and working through them side-by-side.
If you’re new to analysis in Heap, we recommend reviewing Create Your First Chart, which covers helpful charts 101 info.
Introduction
When optimizing your site experience on eCommerce sites, one of the easiest areas to focus on is the checkout flow.
This dashboard focuses primarily on helping you to understand your cart abandonment rate. This refers to the total amount of individuals who include an item to their cart, but don’t complete the checkout process. Cart abandonment is an issue faced by eCommerce businesses of all sizes, and while it may seem like an uphill battle, there are steps you can take to increase conversions.
By understanding your current cart abandonment rate and more importantly, the reasons why your customers abandon their carts, you can improve your customer’s shopping experience and turn more browsers into buyers.
Step 0: Open the in-app dashboard template
First things first: Open up the in-app dashboard template (linked directly below this line) so that you can complete these steps side-by-side.
In-app dashboard template: Checkout performance
Step 1: Define the inputs needed for this dashboard template
To use this dashboard template, you’ll need to select some baseline inputs. In some cases, you’ll have the option to use a default Heap event or property.
If you need to create a new event or property as part of this process, see our guides on creating new events and properties.
Not sure what to put here? See a list of useful events for eCommerce, SaaS, and Financial Services businesses in the Industry Recommendations section of our Getting Started guide.
| Name | Description | Tips for Setting Up |
| View contact info | An event that captures viewing the form for filling out contact information in a checkout flow (page view events are more reliable to use here) | For some customers, this event is not pageview event. Feel free to substitute this with a field change event that signifies that a users is starting to enter their contact info. |
| View shipping info | An event that captures viewing the form for filling out shipping information in a checkout flow (page view events are more reliable to use here) | For some customers, this event is not pageview event. Feel free to substitute this with a field change event that signifies that a users is starting to enter their shipping info. |
| View payment info | An event that captures viewing the form for filling out payment information in a checkout flow (page view events are more reliable to use here) | For some customers, this event is not pageview event. Feel free to substitute this with a field change event that signifies that a users is starting to enter their payment info. |
| order | An event that captures confirmation of a completed order, with an included property for the total price of the order | |
| Add to cart | An event that captures a click on an “Add to Cart” button |
Step 2: Save your new dashboard
This dashboard will be automatically generated as you select your inputs. To save it for future reference, click the Save dashboard button at the top.
Chart Breakdown
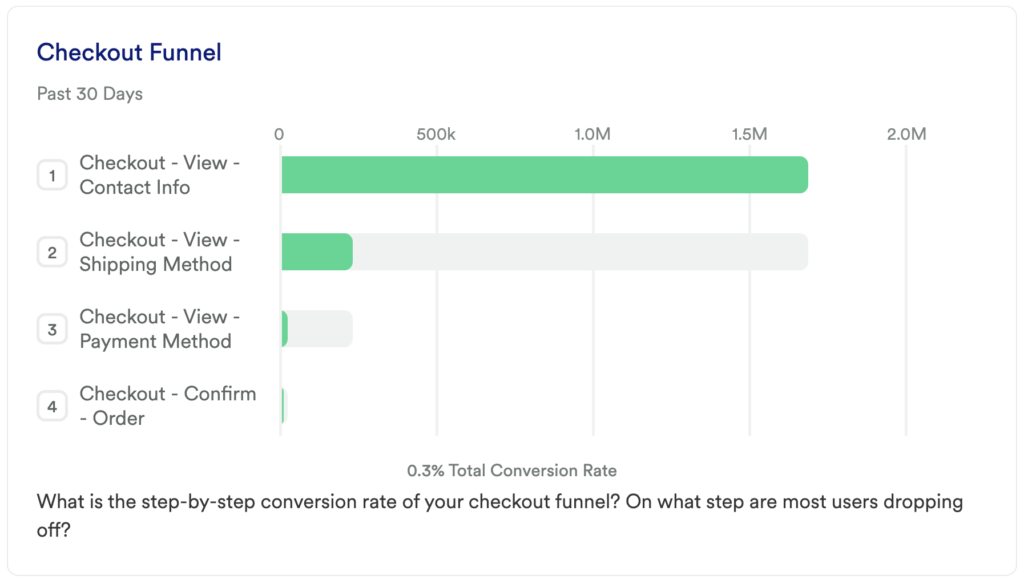
Chart 1: Checkout Funnel
What does it tell you?
This chart looks at your checkout funnel. Once a user gets into this flow, where do you see the biggest dropoff occurring?
How to interpret?
If a user starts the checkout process, they are showing an intent to purchase, so making sure that they can do that simply and efficiently is key to increasing your conversion rate.
One of the simplest reasons we see customers dropping out of this flow is the overall length of the process. Consider if you need all of the fields you are asking for. Is there a way for you to make it easier to enter this information? Can you add a checkout with PayPal or checkout with Amazon option to simplify this?
You’ll also want to ensure that there are no common errors that prevent people from moving forward. You don’t want to lose an order because someone can’t figure out that they need to enter CA instead of California in the state field.
Tip: Add a Group By to see how the conversion rate differs between different cohorts
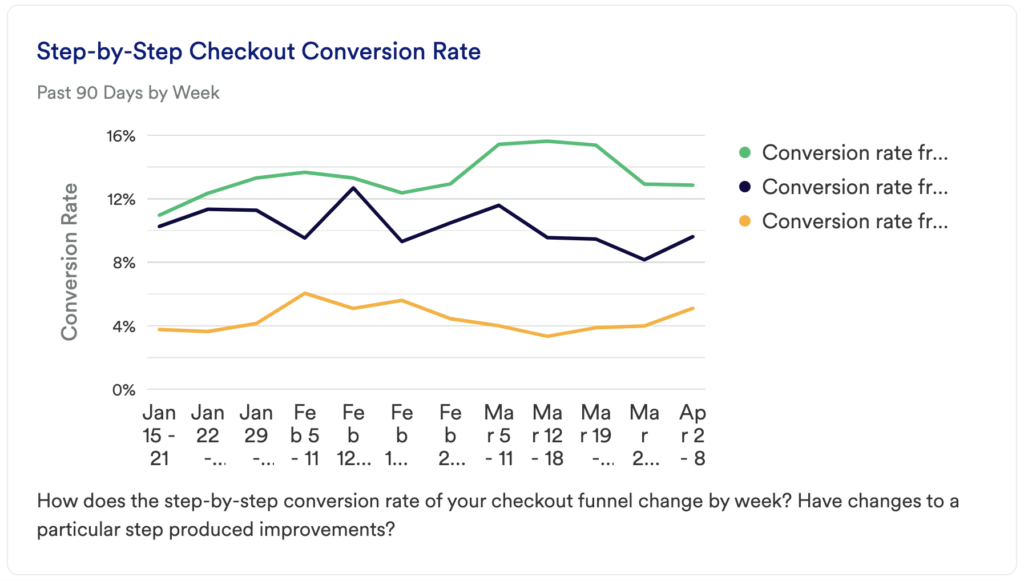
Chart 2: Step-by-Step Checkout Conversion Rate
What does it tell you?
The Checkout Funnel chart showed you the number of unique users dropping off between activation steps. This chart will tell you how each portion of your checkout funnel is improving over time.
How to interpret?
Once you start making changes to your site to optimize, you’ll want to keep track of each of these micro-conversion rates. Maybe you saw an increase in your overall conversion when you redesigned this process, but its small changes can also have an impact.
So as you experiment with small changes, you’ll want to monitor these individual conversion rates. Maybe you didn’t see a change in users getting from the shipping info to the payment method, but if you can increase the number of users who get through the next portion of the funnel, you’re one step closer to improving your overall conversion rate.
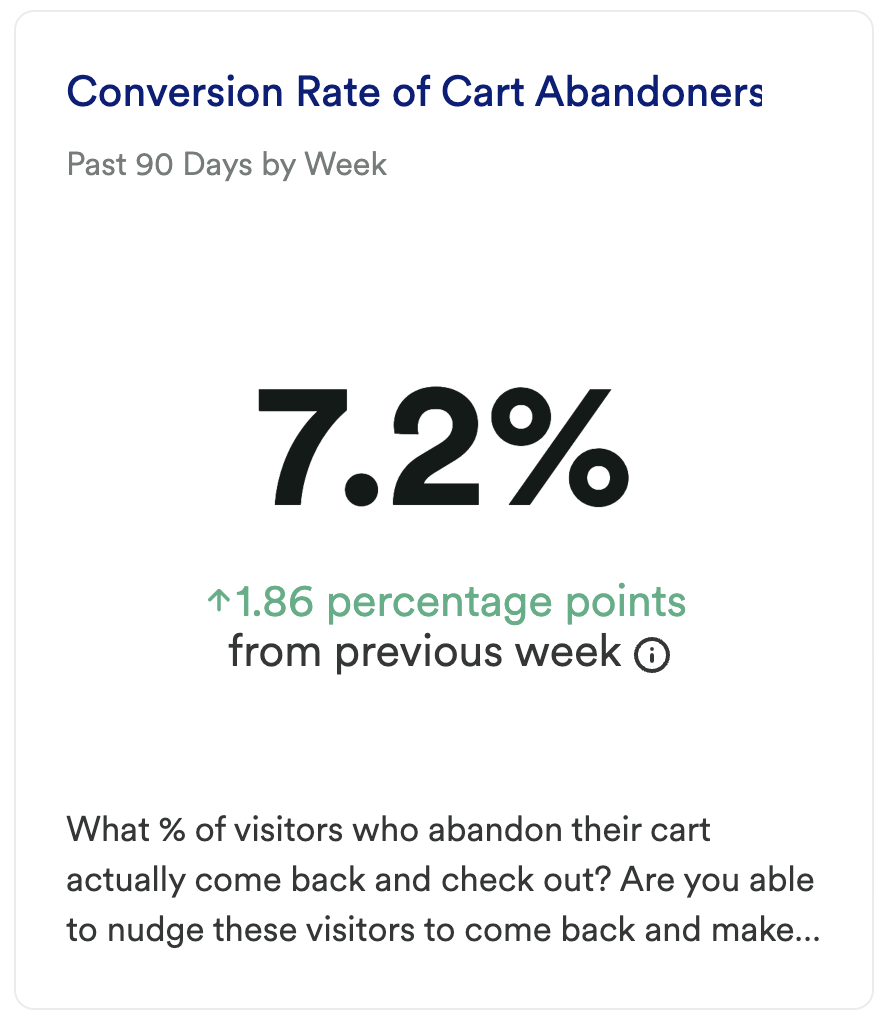
Chart 3: Conversion Rate of Cart Abandoners
What does it tell you?
This chart looks at the % of users who added an item to their cart in the past month, but did not go on to complete a purchase on the same day, then who came back later that month to complete the purchase.
How to interpret?
Your goal here should be to see an increase over time. What can you do to get cart abandoners to come back over time? Have you tried sending out retargeting emails to users who have abandoned an item in their cart? Would a coupon code help here? Have you considered using cookies to store what was in someone’s cart so that when they come back it’s easier to pick up where they left off?
Step 3: Take action
Conversion Rate Optimization (CRO) is a big focus for most of our eCommerce customers. However, it’s also overwhelming to think about all of the places where you could start to improve this conversion rate metric. Cart abandoners have already discovered your brand and signaled that they liked your product(s), which is often half the battle. By focusing on a very specific part of the customer journey, you can use the information in this dashboard to understand what small changes you can make to your checkout flow to improve your overall conversion.
This dashboard is just a starting place – you’ll want to really dig in here to uncover the why behind the behaviors that you’re seeing, use those insights to develop a hypothesis, then go out and test it!
In conclusion
Making improvements to this small section of your customer journey can have a big impact on your bottom line. There are certainly a lot of reasons why customers might abandon the checkout flow; complex processes, form field errors, a poor mobile experience, unexpected costs, etc.
By focusing your analysis efforts here, you may be able to uncover more detailed reasons why your customers are abandoning their carts in the first place. This enables you to take steps to improve the customer experience, which will almost certainly net you greater returns.