To make the most of this guide, you’ll need a baseline understanding of key concepts like events, charts, and properties. If you are still learning about Heap (meaning those terms don’t mean anything to you), we recommend taking our Hello Heap course or reviewing our Setting Up Heap guide prior to jumping into this guide.
This guide is meant to be used in tandem with one of Heap’s in-app Dashboard templates (linked in step 0). We recommend having the template and this guide open and working through them side-by-side.
If you’re new to analysis in Heap, we recommend reviewing Create Your First Chart, which covers helpful charts 101 info.
Introduction
We all know that acquiring new users can be especially difficult… and costly! Marketing budgets will vary, but most companies spend anywhere between 20-50 percent of their annual recurring revenue (ARR) on acquiring new customers.
With that in mind, it’s important to make sure that you’re optimizing that ad spend. This guide will help you to get a broad overview of where you are acquiring your traffic and which of those locations is converting at the greatest rate.
Step 0: Open the in-app dashboard template
First things first: Open up the in-app dashboard template (linked directly below this line) so that you can complete these steps side-by-side.
In-app dashboard template: Acquisition overview
Step 1: Define the inputs needed for this dashboard template
To use this dashboard template, you’ll need to select some baseline inputs. In some cases, you’ll have the option to use a default Heap event or property.
If you need to create a new event or property as part of this process, see our guides on creating new events and properties.
Not sure what to put here? See a list of useful events for eCommerce, SaaS, and Financial Services businesses in the Industry Recommendations section of our Getting Started guide.
| Name | Description | Tips for Setting Up |
| Initial marketing channel | A defined property that groups together similar initial marketing channels (e.g. Email, Display Ads) for a user | Heap has a predefined template to help you set up defaults for this property (see screenshot below). If your definition of channels vary from ours, you can customize the definition and create your own definitions for “marketing channels” |
| Conversion | An event that tracks completion of a goal event (purchase, sign up, etc.) | What is the primary action that you want your users to take? Do you want them to start a free trial, contact sales, attend a demo webinar? This will be important for understanding which channels are having the most success (not just driving the highest volume). |
| View any marketing page | An event that captures all page views that happen on your marketing site | There are a variety of ways to create this event. If you only have Heap installed on your marketing site, then you may simply use the default Pageview event. However, if Heap is installed on your app and your marketing site you will want to differentiate these actions. Typically, you can use the Paths (or URLs) on your site to distinguish between these as shown below. |
Step 2: Save your new dashboard
This dashboard will be automatically generated as you select your inputs. To save it for future reference, click the Save dashboard button at the top.
Chart Breakdown
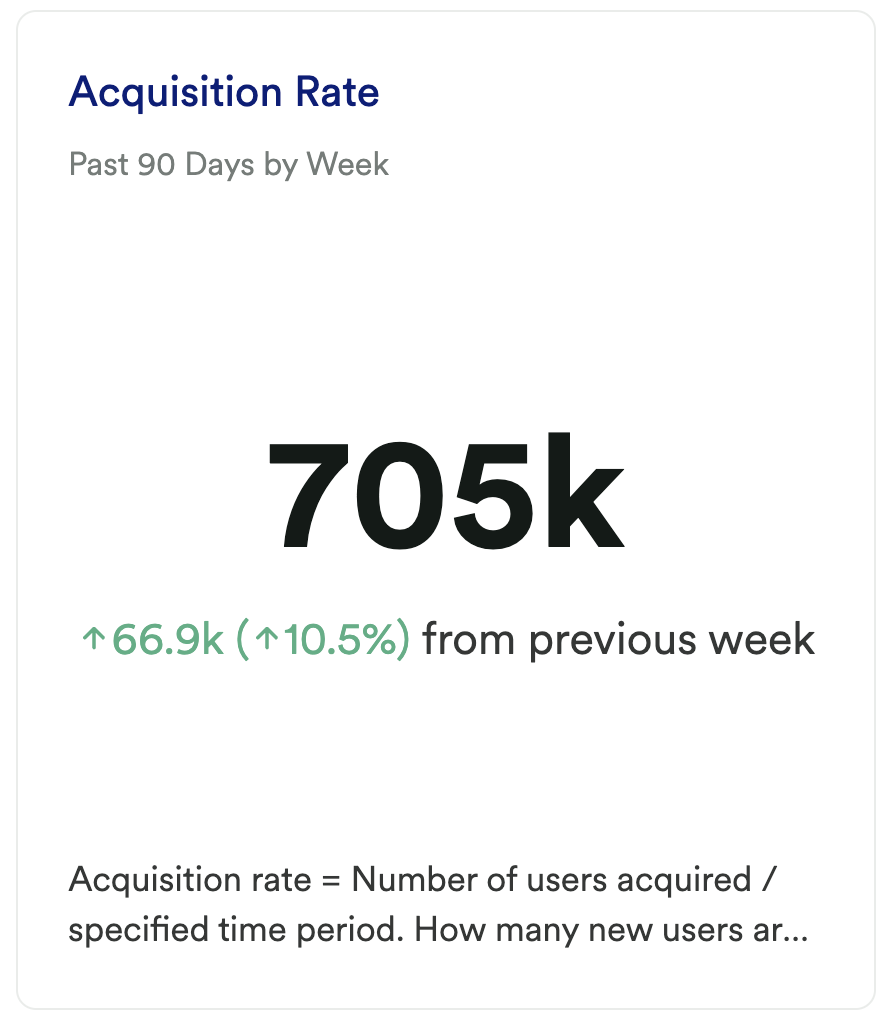
Chart 1: Acquisition Rate
What does it tell you?
This chart looks at your acquisition rate. Specifically, it’s telling you how many new users visited your marketing site each week over the past 90 days.
How to interpret?
Ideally, you see an upward trend here as you improve your acquisition strategies. If you see a sharp dip or spike in a given week try to dig in to understand what might have caused the change. Was there a well-received piece of content that drove more visitors, was there a new feature released, was there a seasonal event that might have naturally caused a change in your traffic, were you holding a conference that week, did you get mentioned in the press?
Understanding what caused the change means that you can try to replicate the positive and avoid those actions that caused negative results.
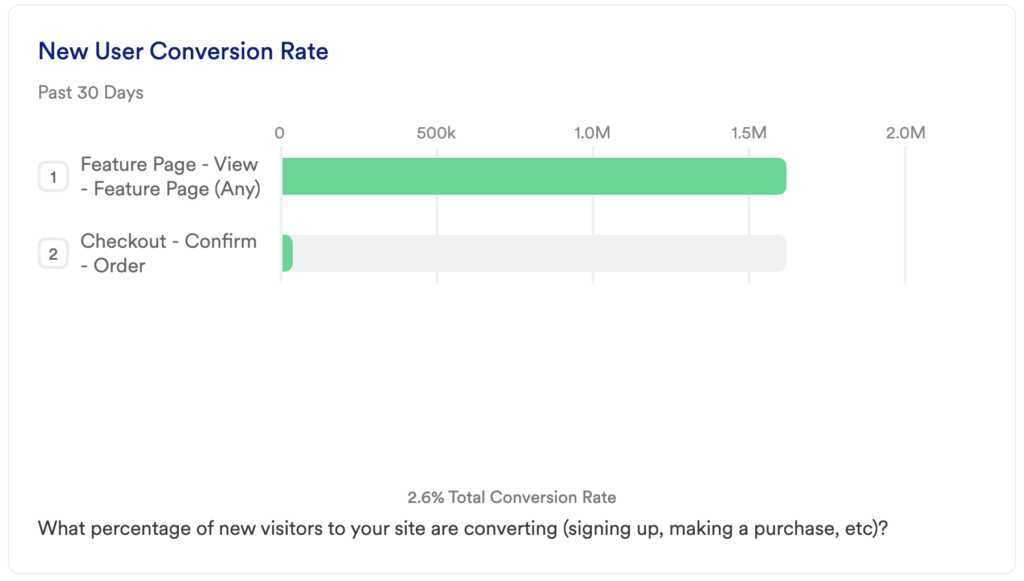
Chart 2: New User Conversion Rate
What does it tell you?
This chart will show you how many of your new users in the last 30 days completed your primary conversion event.
How to interpret?
If this number is low, don’t panic! For SaaS companies, a conversion rate between 5-10% is considered good, and eCommerce sites only see a 2% conversion rate on average. The key here is seeing improvement over time, and this chart will tell you both where you are starting from and where to focus attention.
Add a Date Range Comparison to see how this chart changed compared to a previous period.
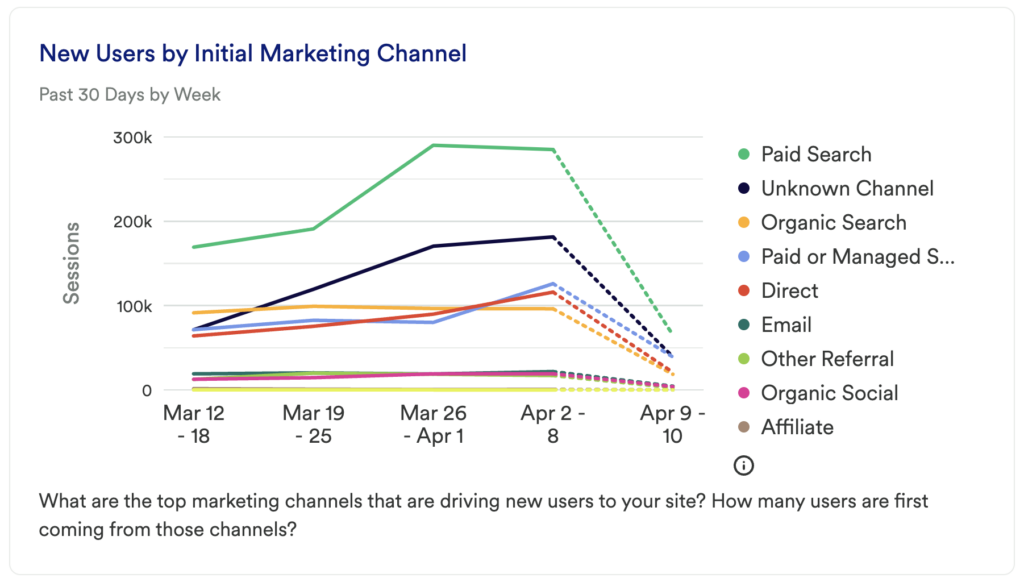
Chart 3: New Users by Initial Marketing Channel
What does it tell you?
We already have a chart that’s looking at your overall acquisition rate; this chart will start to tell you which of your marketing channels is driving the majority of your traffic.
How to interpret?
Are there certain channels that are performing above the rest? Do you notice a difference between paid channels and organic channels? Is there any clear winner between email, search or social channels? Was there a spike in any of these?
Before you jump to investing in the channels that are driving the most traffic, you’ll also want to compare this to the next report (Top Converting Initial Marketing Channels) to ensure that the high traffic is translating into higher conversions as well.
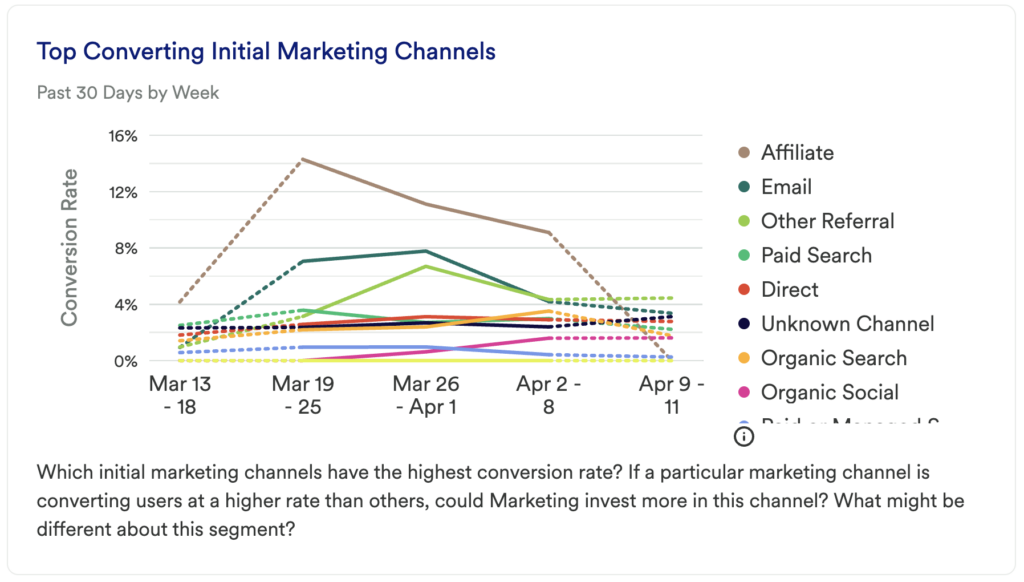
Chart 4: Top Converting Initial Marketing Channels
What does it tell you?
The previous chart showed you which channels were driving the most traffic. It’s equally important to understand which channels are converting at the greatest rate.
How to interpret?
What’s surprising here? Are your highest-traffic drivers also your best-converting channels?
If so, great, you’re probably investing in the right places. However, if you see a channel(s) that’s outperforming others, you may want to dig in. Could Organic Social be so successful because influencers/customers are sharing your product, or is this just where most of your target demographic hangs out? Do you see a spike in your email conversions one week? If so, what new campaign did you lunch or what new audience did you reach out to?
Find the outliers here, and then build a strategy to try and capture and replicate your success.
Chart 5: New Users by Initial UTM Source
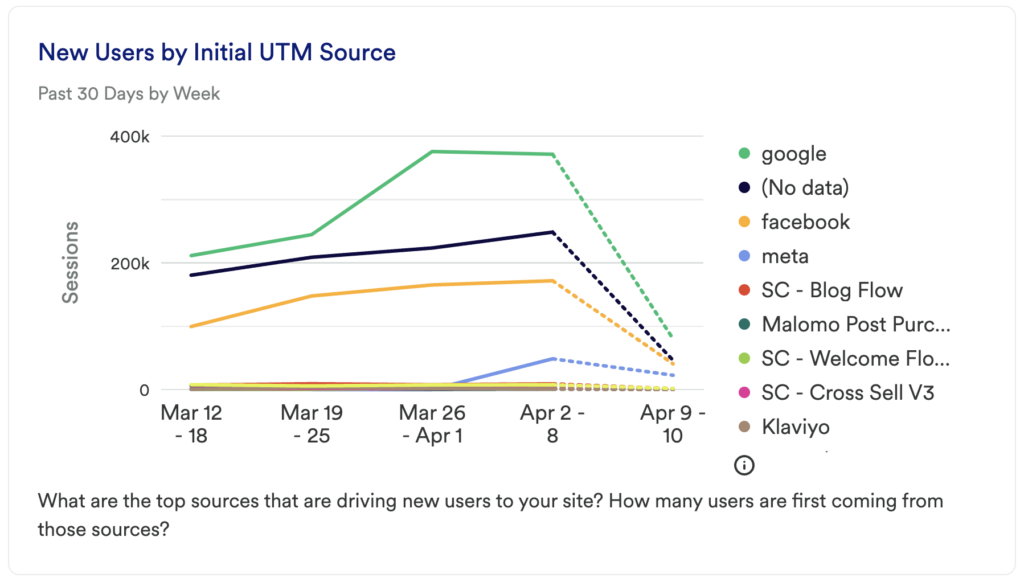
What does it tell you?
Now that you’ve taken a look at the channels, this is a chance to go deeper into that analysis. It’s great that paid search traffic was up, but did you see more results from Google or Bing? (Don’t laugh, we’ve seen it happen!)
We chose to Initial UTM Source, though you could swap this for any of the UTM parameters you’d like.
How to interpret?
Just like before, you want to understand where you’re seeing the best and the worst results then dig in to learn more.
Chart 6: New vs Returning Users
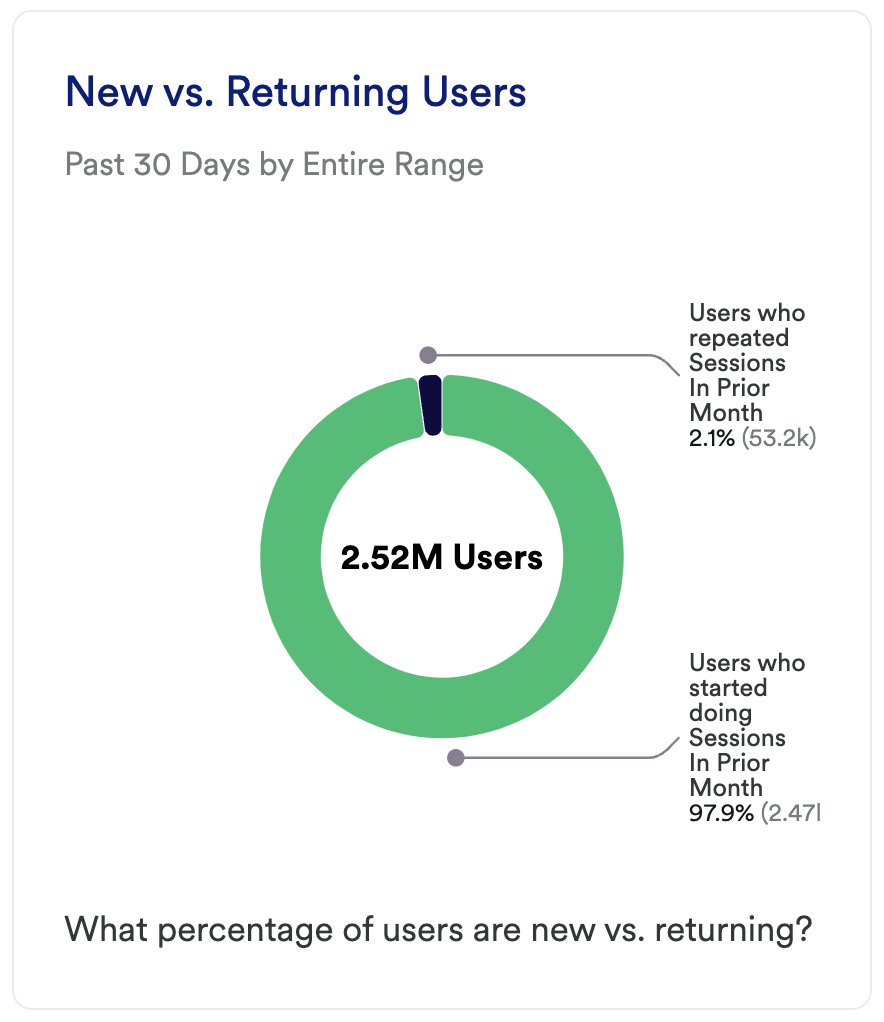
What does it tell you?
Many of the charts we’ve looked at so far have just looked at your overall traffic. This chart will help you to understand how much of that traffic are new users (visiting for the 1st time in the past 30 days) vs users who continue to come back to your site.
How to interpret?
If you are like most sites, you are going to have way more new users than returning users. However, many studies have shown that returning users have higher engagement rates with your site. More importantly, they also tend to have higher conversion rates and higher sales.
For eCommerce sites, it’s not uncommon to have 95% of your traffic be from new users. We discussed earlier that conversion of only 2% is good, though for SaaS, where the sales cycle is longer, you may get a higher percentage of returning users who continue to research you throughout the sales cycle. If you also have strong blog content, you may get more returning visitors who are there to consume your content.
Having a low number of returning users may be standard or expected for you, and therefore normal. For others, it could mean that your content (or product) is not resonating with your audience.
Chart 7: New vs Returning Users by Week
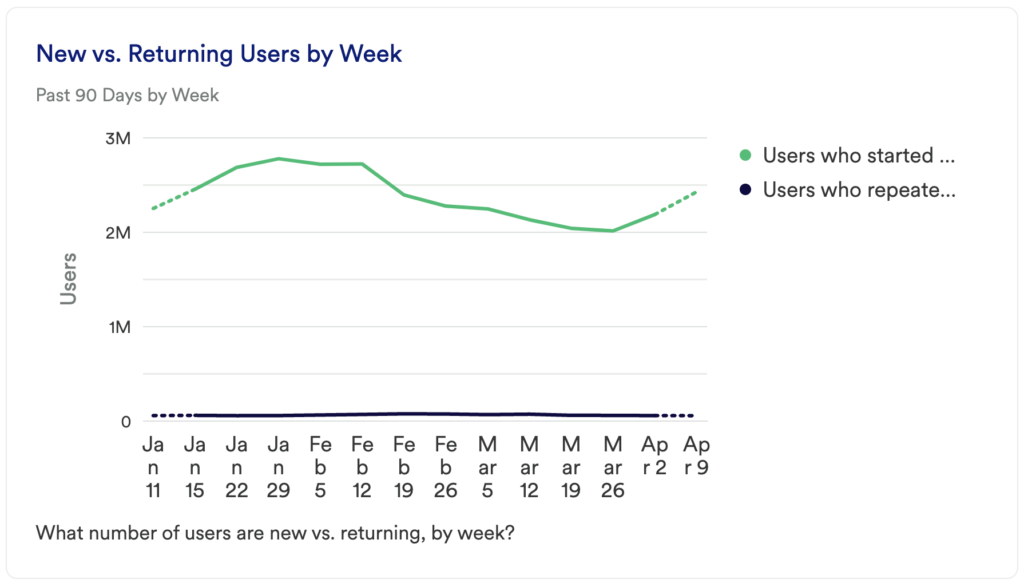
What does it tell you?
Instead of looking at overall new vs returning users in a given time frame, this helps you look at your trends over time.
How to interpret?
As you make changes to your site and/or release new content, pay attention to any changes in this metric. It can tell you how successful your content is at keeping users engaged.
Chart 8: Top Converting Landing Pages
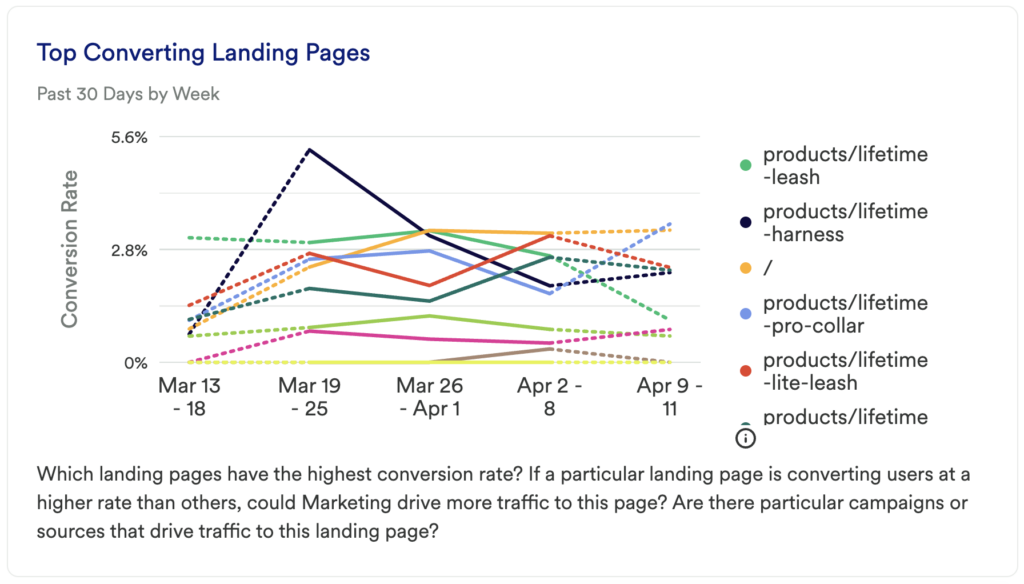
What does it tell you?
Different landing pages for different advertisements, ads, or email campaigns are great. They let you personalize your messaging or give your users a simplified CTA. This chart doesn’t just look at the traffic being driven to those pages, but more importantly, it will tell you which is having the greatest impact on your Conversion event.
How to interpret?
We all know that first impressions matter. If you don’t capture your prospect’s attention when they land on the site, you’re likely to lose them forever. So understanding which content is performing at a high level can help you refine your marketing strategy.
Use this chart to inform your future experiments. Does a certain Solution-specific page get more signups? Does a particular product page get more purchases compared to bringing users to the homepage? Was there a particular webinar signup that led to people starting a trial?
Having this information will help you make strategic decisions going forward about where to drop your new users.
Chart 9: New Users by Initial Landing Page
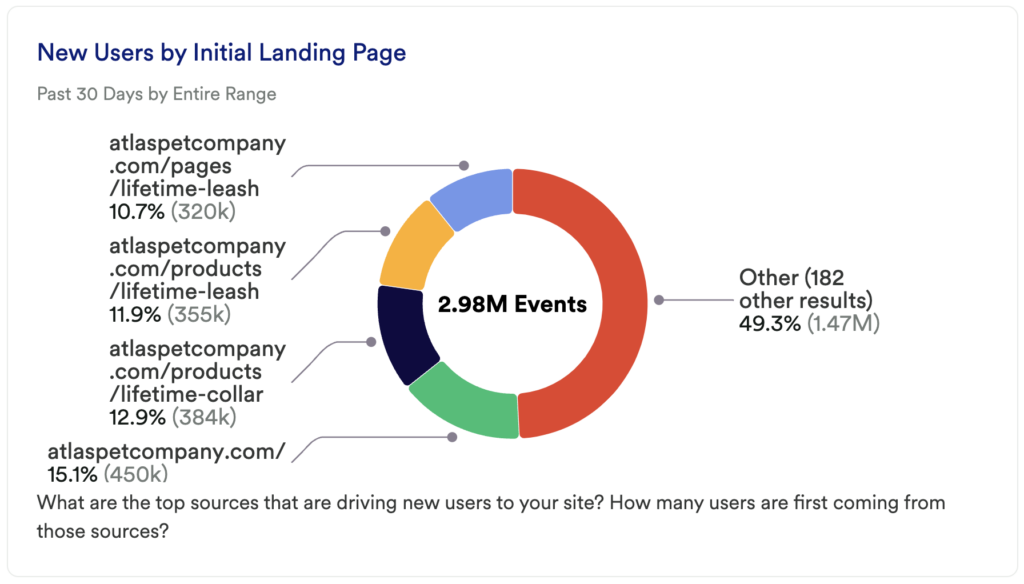
What does it tell you?
This chart is going to tell you which of your landing pages are getting the most traffic.
How to interpret?
As we mentioned earlier, it is important to know where your traffic is coming from, and in this case, where they are landing. But as we mentioned earlier, it’s not enough to just drive traffic to a particular landing page; you’ll want to compare this to the previous chart to understand what’s working and what’s not.
Step 3: Take action
Refining your acquisition strategy is a never-ending process, and there’s no silver bullet that we can give you here. However, this dashboard should give you an idea of where you might want to invest your time over the next month or next quarter.
Where do you think you can find the most leverage? Experiment with changing your spend between different channels, augmenting your content strategy, and learning from the insights here.
Then, keep measuring! This is an iterative process. Get the data, look for insights, take action, then go back to the data to measure the results of your work!
In conclusion
It’s getting harder and harder to acquire new customers, so it’s important that you use all of the tools you can to make sure that you acquire more than your competitors. Using data to inform your acquisition strategy is the first step to ensuring that you grow your business.