To make the most of this guide, you’ll need a baseline understanding of key concepts like events, charts, and properties. If you are still learning about Heap (meaning those terms don’t mean anything to you), we recommend taking our Hello Heap course or reviewing our Setting Up Heap guide prior to jumping into this guide.
This guide is meant to be used in tandem with one of Heap’s in-app Dashboard templates (linked in step 0). We recommend having the template and this guide open and working through them side-by-side.
If you’re new to analysis in Heap, we recommend reviewing Create Your First Chart, which covers helpful charts 101 info.
Introduction
Use this dashboard template guide to understand how “sticky” your product is, which can shed light on which parts of your product are habit-forming.
Step 0: Open the in-app dashboard template
First things first: Open up the in-app dashboard template (linked directly below this line) so that you can complete these steps side-by-side.
In-app dashboard template: Activation overview
Step 1: Define the inputs needed for this dashboard template
To use this dashboard template, you’ll need to select some baseline inputs. In some cases, you’ll have the option to use a default Heap event or property.
If you need to create a new event or property as part of this process, see our guides on creating new events and properties.
Not sure what to put here? See a list of useful events for eCommerce, SaaS, and Financial Services businesses in the Industry Recommendations section of our Getting Started guide.
| Name | Description |
| Submit sign up | An event that captures submitting a sign up form for your product (after filling out the form) |
| Activation | An event that captures the moment when a user first gets value from your product—usually the moment when that user first does the thing your product is built for them to do. |
| Active usage | A user action that you use to define an active user when counting daily/weekly/monthly active users (choose “Session” if you define an active user as any visitor) |
| Click sign up CTA | An event that captures clicking the call to action for your sign-up form. |
Step 2: Save your new dashboard
This dashboard will be automatically generated as you select your inputs. To save it for future reference, click the Save dashboard button at the top.
Chart Breakdown
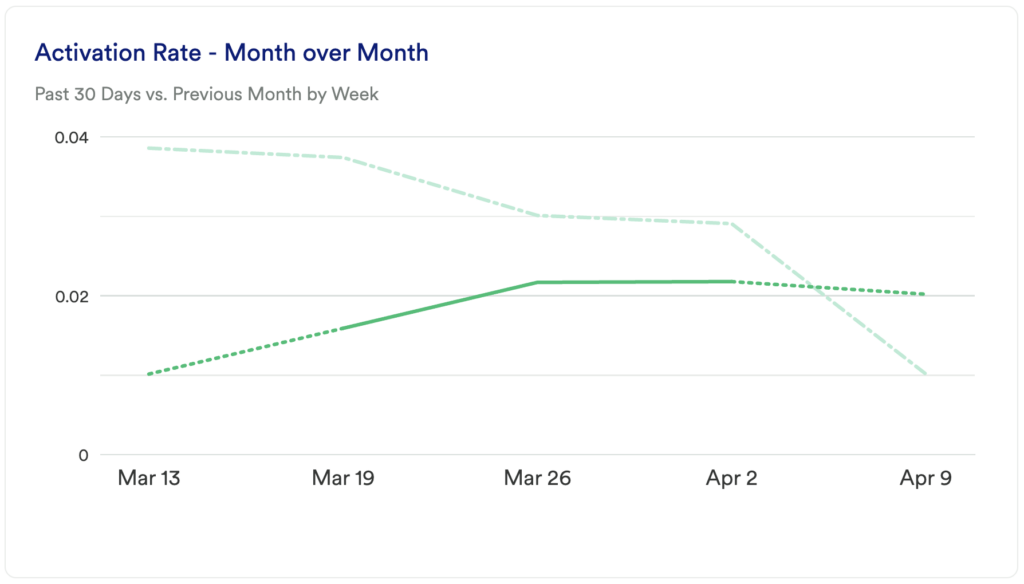
Chart 1: Activation Rate: MoM
What does it tell you?
This chart looks at your activation rate. Specifically, it’s telling you, over the past month, how many users performed your active usage event(s) within a 7 day period. Additionally, this chart compares this month to the previous month to see any changes in usage.
How to interpret?
Ideally, you’ll see an upward trend here as you improve your activation strategies. If you see a sharp dip or spike in a given week try to dig in to understand what might have caused the change. Did you launch new educational content designed to better educate users, is there new in-app guidance, is your team supporting customers with new onboarding and training practices?
Understanding what caused the change means that you can try to replicate the positive and avoid those actions that caused negative results.
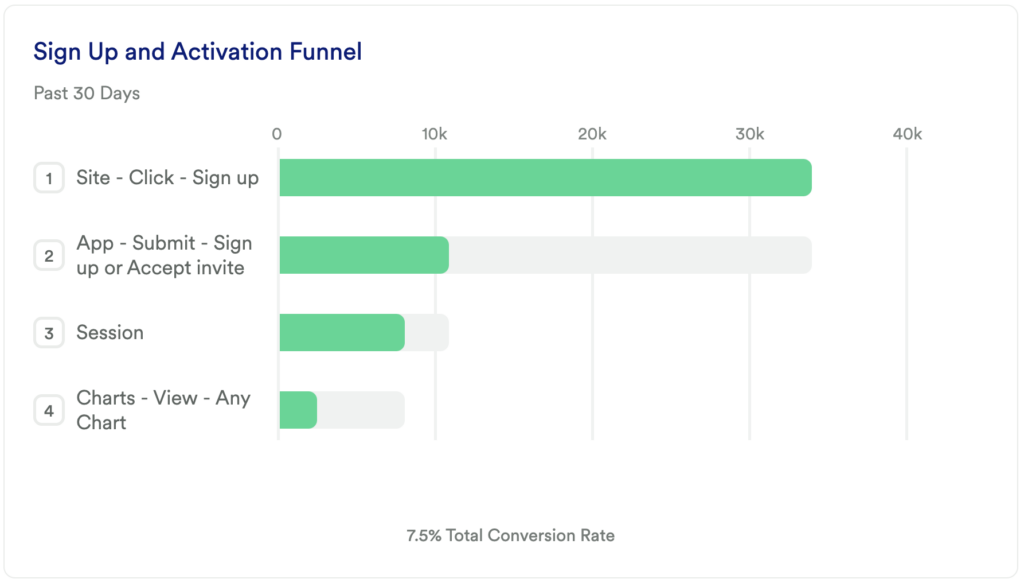
Chart 2: Sign-Up and Activation Funnel
What does it tell you?
This chart will show you how many new users in the last 30 days completed your sign-up and primary activation event.
How to interpret?
If this number is low, don’t panic! The key here is seeing improvement over time, and this chart will tell you where you are starting from.
Tip: Add a Date Range Comparison to see how this chart changed compared to a previous period.
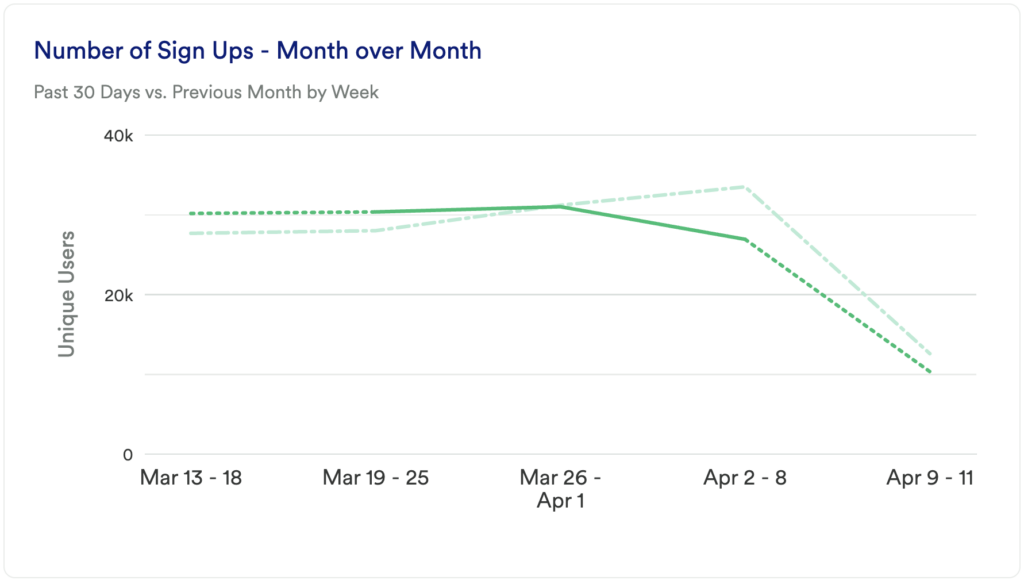
Chart 3: Number of Sign-Ups – MoM
What does it tell you?
This chart will show you how many unique users interacted with your sign-up event in the past 30 days, compared to the previous month.
How to interpret?
This offers a great baseline of new sign-ups in a given month compared to the previous month. The number of users found in this chart can be especially helpful when comparing this data against the Activation Rate – MoM report. It will tell you how many users signed up versus how many users performed your desired activation event(s) in a timely manner.
Do you see a major drop off in the most recent week? If you are early in the week, toggle on Hide Incomplete Time Periods for a more accurate visualization.
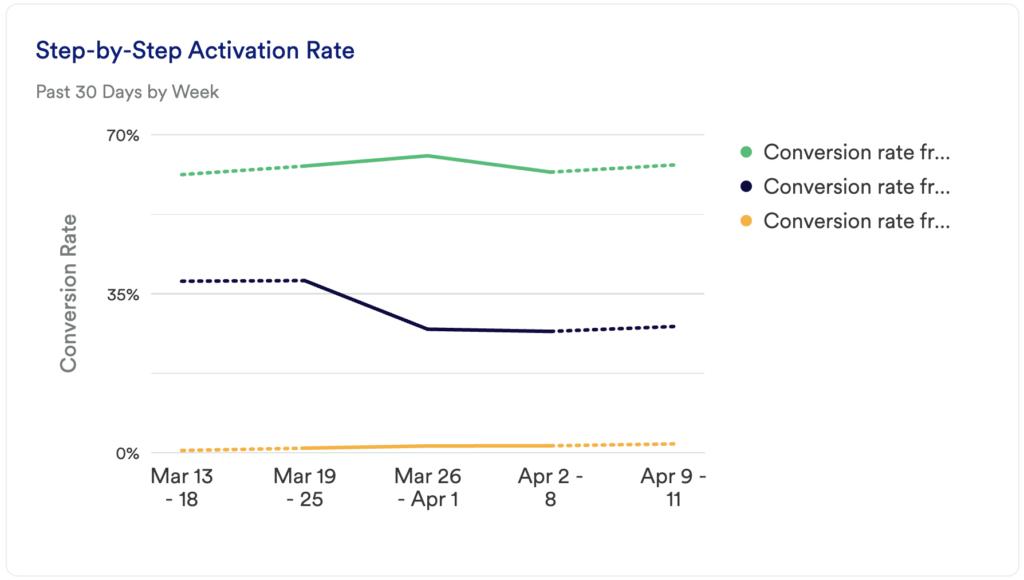
Chart 4: Step-by-Step Activation Rate
What does it tell you?
The Sign-Up and Activation funnel chart showed you the number of unique users dropping off between activation steps, but it’s equally important to understand the percentage of users who make it from one step to the next.
Chart 5: Number of Activated Users – MoM
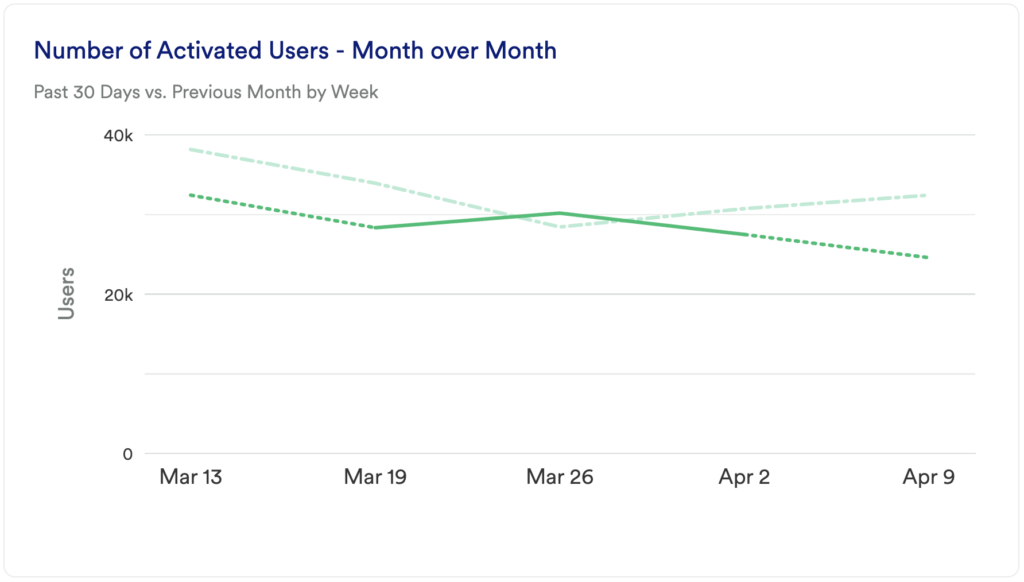
What does it tell you?
We’ve taken a look at Activation Rate and Number of Sign-Ups, but simply understanding the number of new users who have performed your primary activation event and comparing that month over month can be telling.
How to interpret?
Just like before, you want to understand where you’re seeing dips and spikes, then dig in to learn more. What is causing those dips and spikes and recreate anything that potentially leads to an increase in users interacting with your primary activation event and continue to monitor this number and how it changes.
Chart 6: Time Between Activation Steps by Week
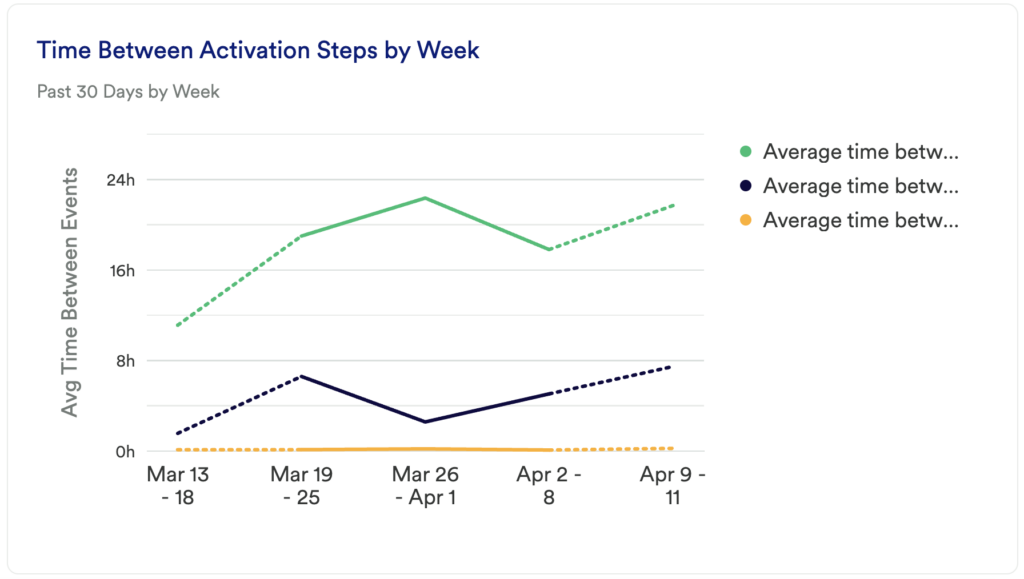
What does it tell you?
The other charts in this dashboard give you an idea of the number of unique users or percentage of users who have performed some action. T this report tells you how long it takes users to complete each step in your activation funnel.
How to interpret?
Knowing how many users go from one step to the next in an activation funnel is important, but, on average, how long does it take those users to complete those actions? Every step that takes a long time to complete is an opportunity for a user to abandon the step.
You can even compare your findings in this report to the Sign-Up and Activation Funnel – are there major drop-off points in that funnel that you see take a long time for users to successfully complete in this report? This can be an indicator of a major barrier that could be solved via site improvements or educational opportunities, for example.
Step 3: Take action
Refining your activation strategy is a never-ending process that will take you through many iterations, especially as your site or product goes through changes and updates. However, this dashboard should give you an idea of where you might want to invest your time over the next month or next quarter.
Where do you see the biggest gaps in your activation funnel? Do you see a long time between active usage events and your activation event? Dig even deeper and segment by user types to see who is the most (or least) successful when going through your activation funnel.
Experiment with different strategies to minimize time to activation and learn from those insights here. This is an iterative process. Get the data, look for insights, take action, then go back to the data to measure the results of your work!
In conclusion
Safe to say, everyone wants users to easily and quickly find value in their tool. It can often be a challenge identifying where users are struggling, and how long it takes them to perform your activation event, which in turn can lead to a chaotic or even nonexistent activation strategy.
Using Heap data to inform your activation strategy is the first step to ensuring that you retain your users and ultimately grow your business.