To make the most of this guide, you’ll need a baseline understanding of key concepts like events, charts, and properties. If you are still learning about Heap (meaning those terms don’t mean anything to you), we recommend taking our Hello Heap course or reviewing our Setting Up Heap guide prior to jumping into this guide.
This guide is meant to be used in tandem with one of Heap’s in-app Dashboard templates (linked in step 0). We recommend having the template and this guide open and working through them side-by-side.
If you’re new to analysis in Heap, we recommend reviewing Create Your First Chart, which covers helpful charts 101 info.
Introduction
This dashboard provides a birds-eye view of engagement with your website, including top pages, audience demographics, and more. We recommend this as your very first Heap dashboard, since it works with even a few hours of automatically captured data.
Step 0: Open the in-app dashboard template
First things first: Open up the in-app dashboard template (linked directly below this line) so that you can complete these steps side-by-side.
In-app dashboard template: Site overview
Step 1: Define the inputs needed for this dashboard template
To use this dashboard template, you’ll need to select some baseline inputs. In some cases, you’ll have the option to use a default Heap event or property.
If you need to create a new event or property as part of this process, see our guides on creating new events and properties.
Not sure what to put here? See a list of useful events for eCommerce, SaaS, and Financial Services businesses in the Industry Recommendations section of our Getting Started guide.
| Name | Description |
|---|---|
| Initial browser type | A property that groups together values of the Initial Browser property by browser for more readable analysis (you can use the Heap default) |
| Initial marketing channel | A property that groups together similar initial marketing channels (e.g. Email, Display Ads) for a user (you can use the Heap default) |
Step 2: Save your new dashboard
This dashboard will be automatically generated as you select your inputs. To save it for future reference, click the Save dashboard button at the top.
Chart Breakdown
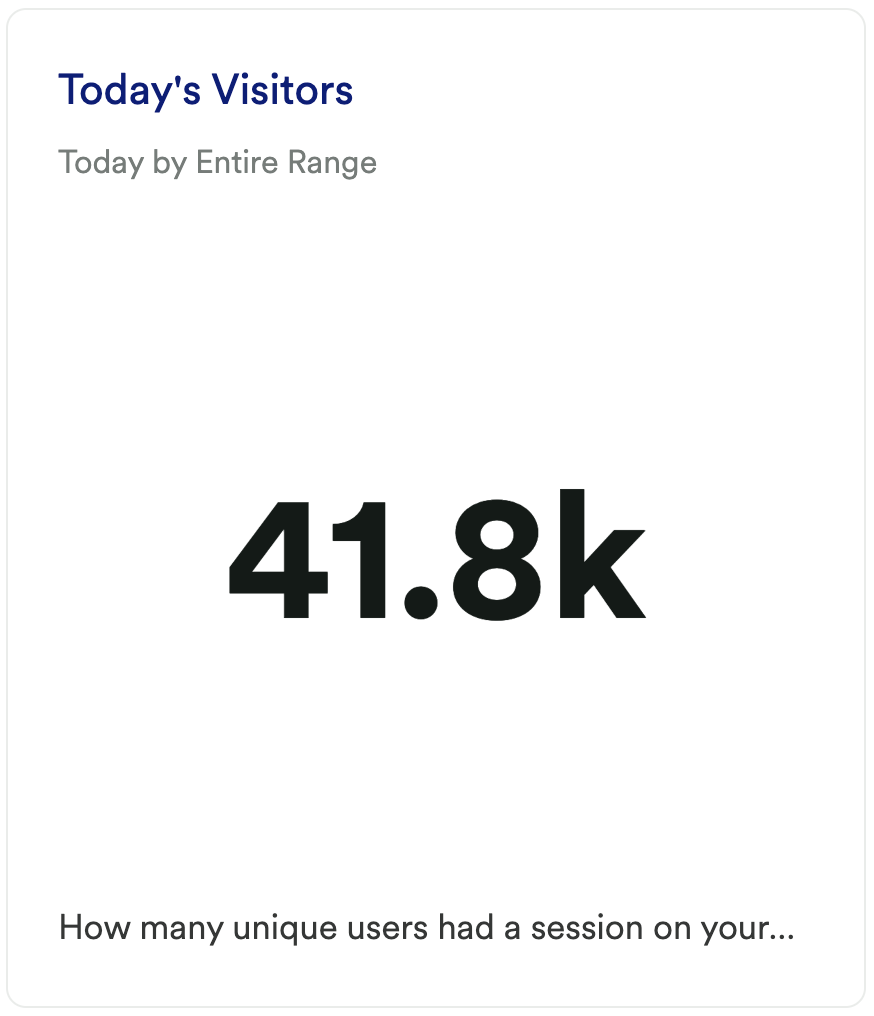
Chart 1: Today’s Visitors
What does it tell you?
This chart shows you how many unique users had a visit (session) on your site today.
How to interpret?
When you first create this chart, it’s really about getting a baseline, though we recommend you monitor this over time to ensure that your traffic is growing.
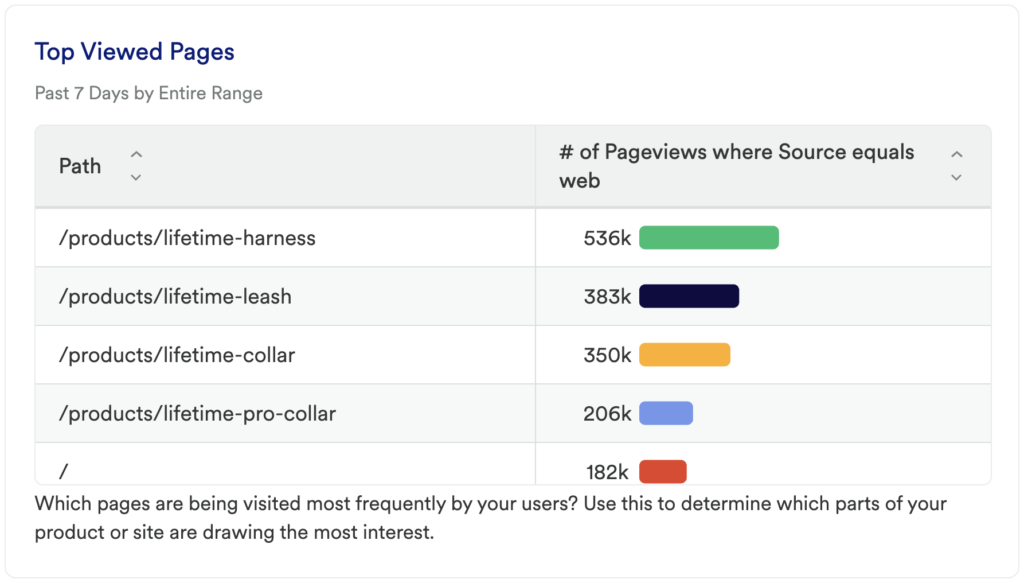
Chart 2: Top Viewed Pages
What does it tell you?
This will show you the specific pages on your site that are getting the most traffic.
If the Title results aren’t descriptive enough, you can switch the Group By to use the Path property which will give you the URL of the page instead.
How to interpret?
Understanding what content is getting used is key to understanding what your visitors find interesting and or helpful.
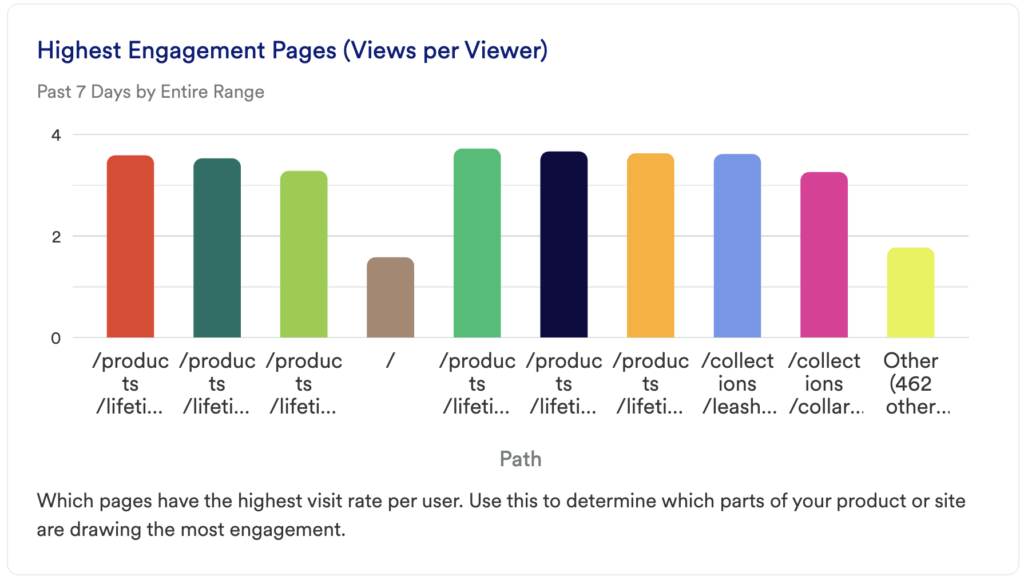
Chart 3: Highest Engagement Pages (Views per Viewer)
What does it tell you?
Which pages have the highest visit rate per user.
How to interpret?
Use this to determine which parts of your product or site are drawing the most engagement.
If the Title results aren’t descriptive enough, you can switch the Group By to use the Path property which will give you the URL of the page instead.
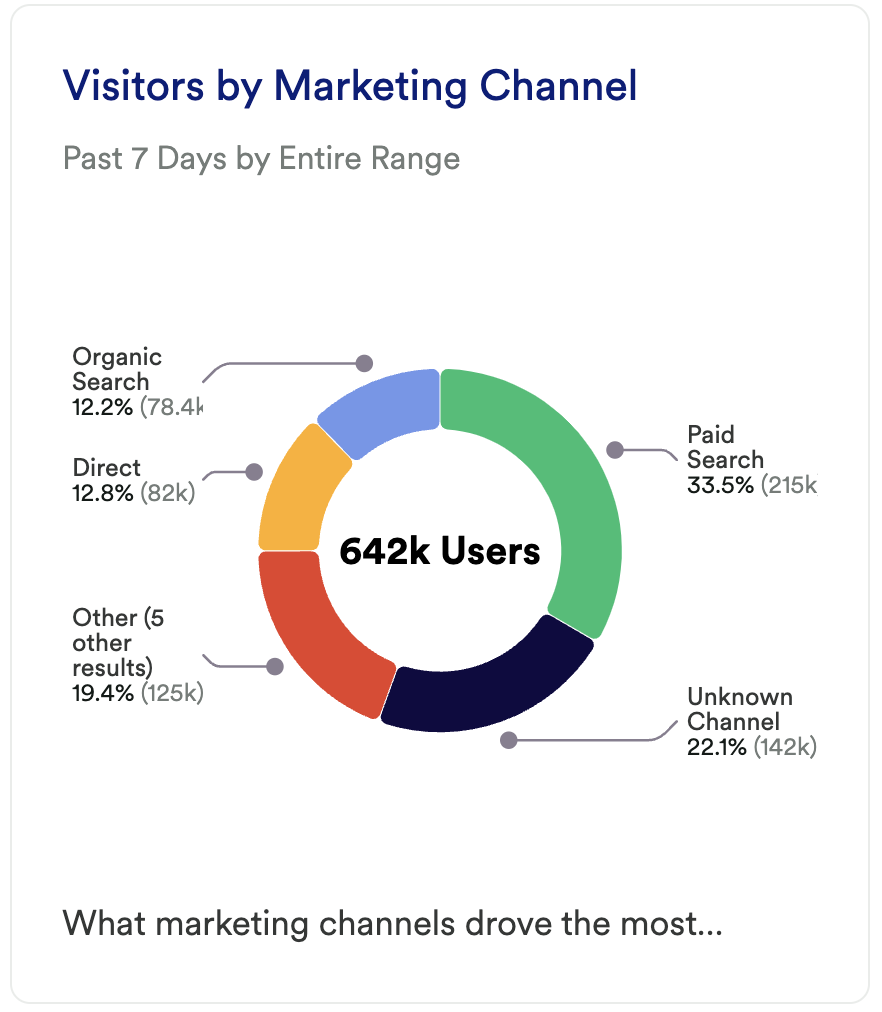
Chart 4: Visitors by Marketing Channel
What does it tell you?
Which of your marketing channels is driving the majority of your traffic?
How to interpret?
Are there certain channels that are performing above the rest? Do you notice a difference between paid channels and organic channels? Is there any clear winner between email, search or social channels? Was there a spike in any of these? Before you jump to investing in the channels that are driving the most traffic you’ll also want to understand which Channels lead to highest conversion as well.
Chart 5: Visitor’s First Landing Page
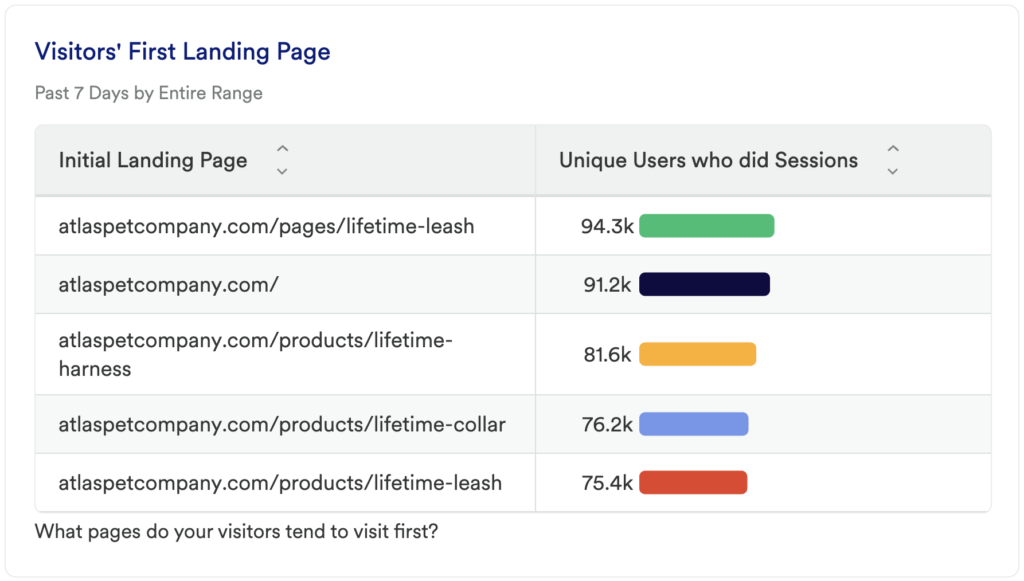
What does it tell you?
This chart is going to tell you which of your landing pages are getting the most traffic. Where are users starting their session?
How to interpret?
It is important to know where your traffic is coming from, and in this case, you’ll want to investigate where they are landing. Keep in mind it’s not enough to just drive traffic to a particular landing page, you’ll want to compare this to landing pages with this highest conversion rate to fully understand what’s working, and what’s not.
Chart 6: Visitors per Day
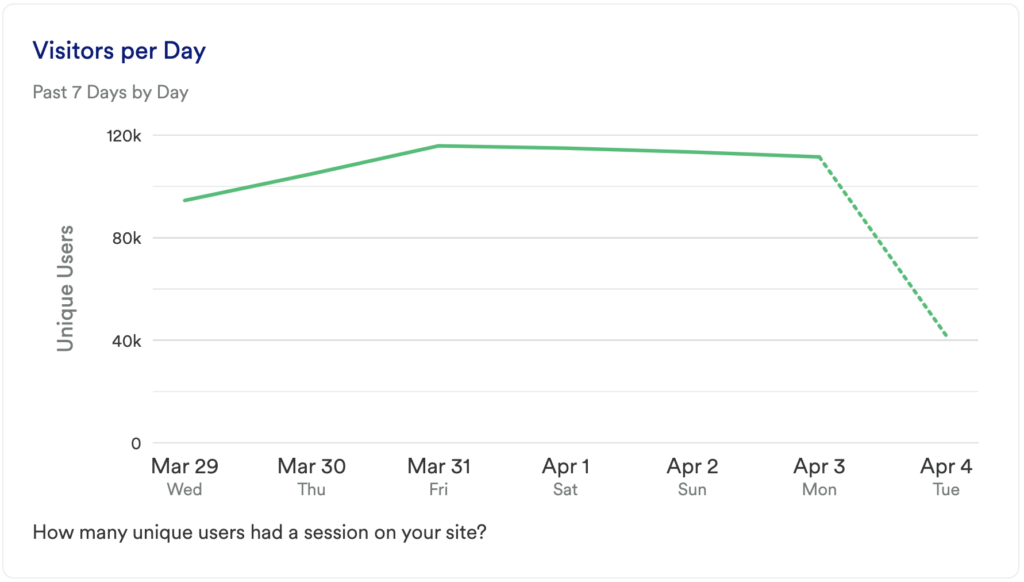
What does it tell you?
This chart will show you how many unique visits (sessions) you’ve had to your site on a daily basis in the last 7 days.
How to interpret?
If this number is going up, then great, it means you are getting more traffic. If you see a spike try to figure out what caused it. Being able to replicate this success in the future can have a meaningful impact on your business. Try grouping by Referrer, Landing Page, or a behavioral segment to see if you can uncover the cause of the change.
Chart 7: Visitors by Country
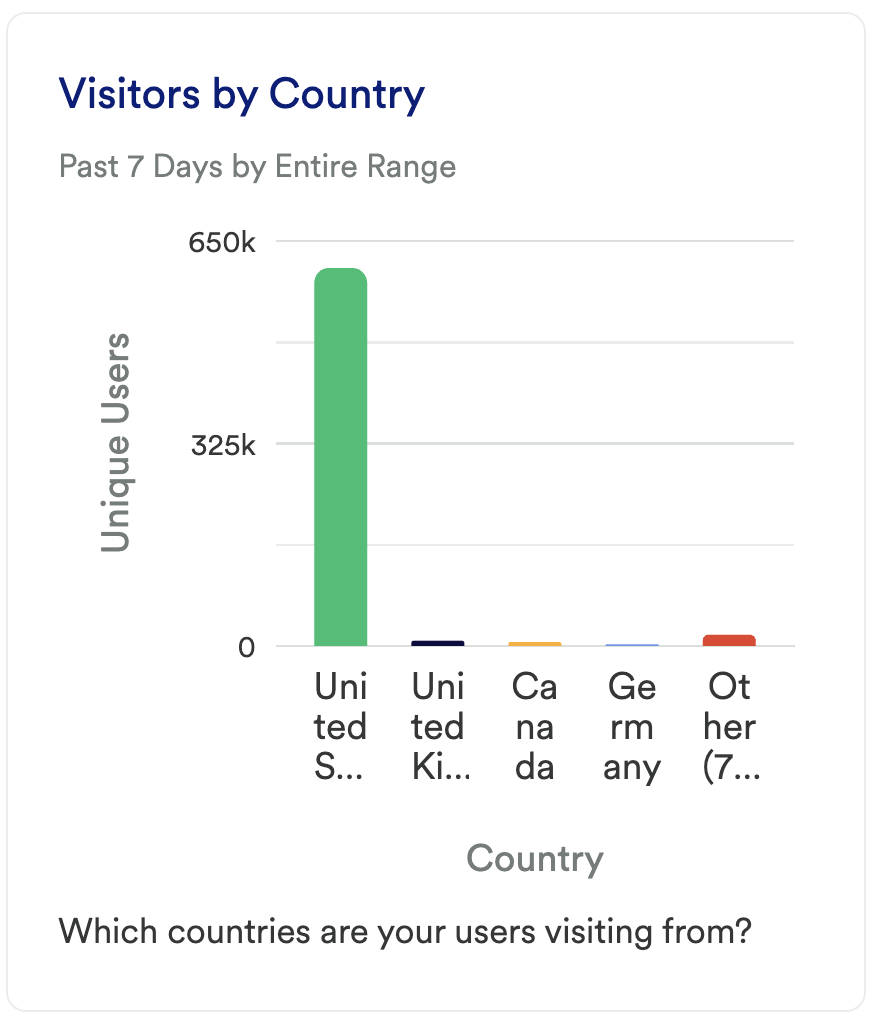
What does it tell you?
This chart is going to tell you which countries your users are visiting from.
How to interpret?
Any surprises here can uncover some untapped markets that you may want to try advertising to.
Chart 8: Visitors by Device Type
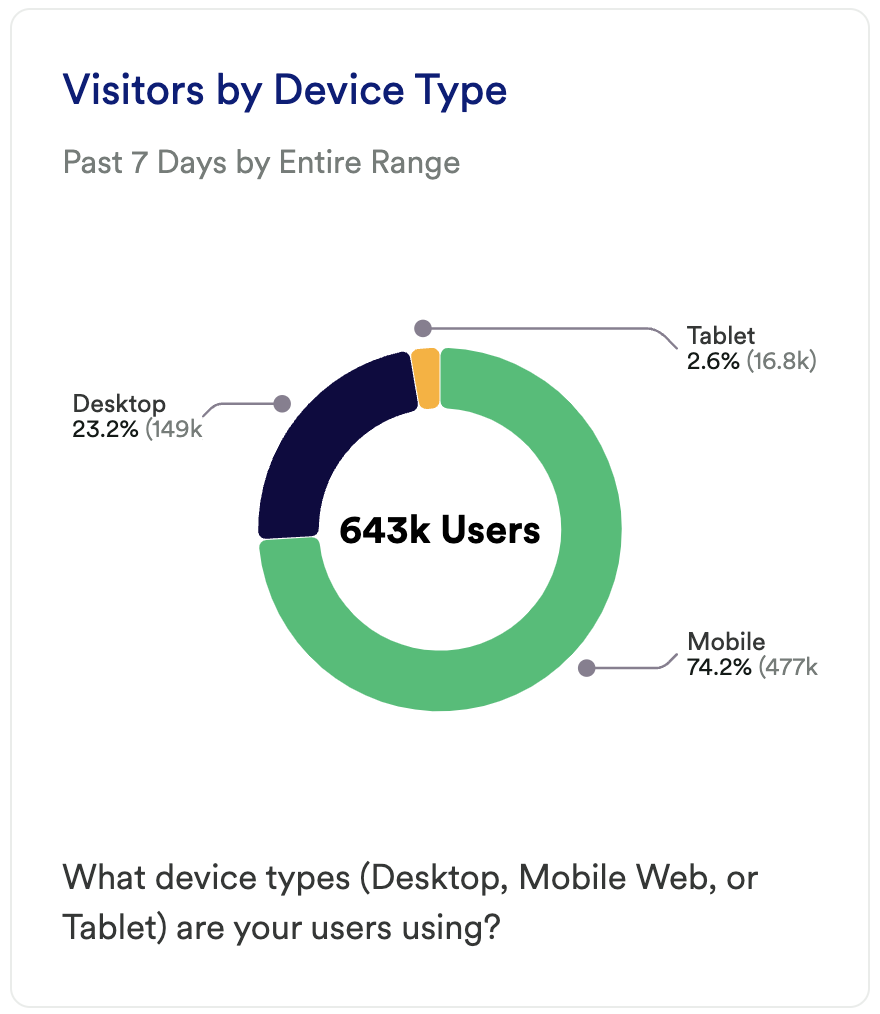
What does it tell you?
This chart will show you which devices your users are using to access your site (Desktop, Mobile Web, or Tablet).
How to interpret?
If you see that a high percentage of your users are visiting from any of these device types, you’ll want to make sure that you spend some time optimizing the user experience for each of them.
Chart 9: Visitors by Browser
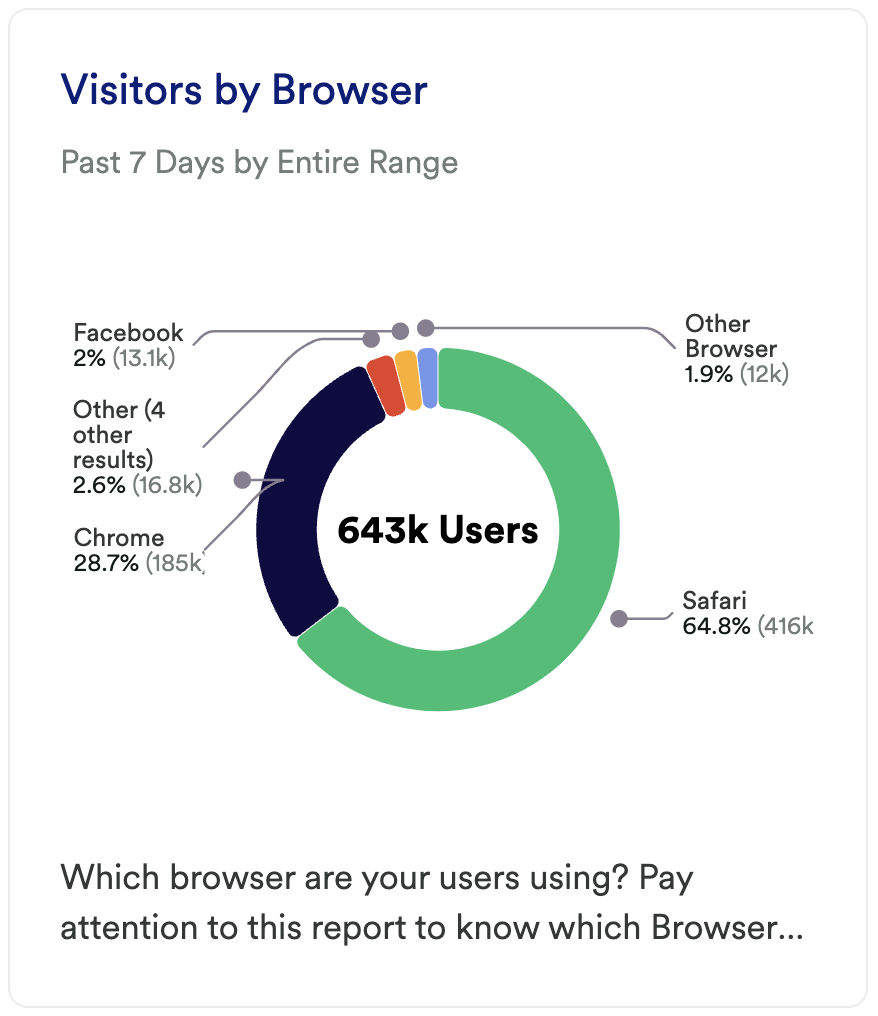
What does it tell you?
This chart is going to tell you which browsers your users are visiting from.
How to interpret?
Similar to the previous chart, this chart is about understanding where you need to optimize for performance reasons. If you see a high number of users visiting your site who are using IE 11, then you’ll want to make sure that your site performs well in that Browser.
Step 3: Take action
This dashboard contains the metrics you’ll want to look at to decide where you want to focus. While most of this data is high-level, it can give you a good overview of your traffic. Did you notice that your blog pages aren’t getting viewed? Maybe it’s time to retire that portion of your site, change your content strategy, or try some campaigns that advertise it.
Where do you think you can find the most leverage with acquiring new users? Experiment with changing your spend between different channels, augmenting your content strategy and learning from the insights here. Try to uncover what caused the change as replicating that could be key to your success.
Then, keep measuring! This is an iterative process. Get the data, look for insights, take action, then go back to the data to measure the results of your work!
In conclusion
If you’re just starting out with analytics, you’ll want to understand your audience demographics ASAP. This guide will help you to do just that.