Overview
You can use visual labeling in Heap to select and label raw bits of data as events, which you can then use in analysis. No coding knowledge is required, though it is useful for refining your events further after they’ve been labeled.
Note that we only officially support visual labeling in the Chrome browser.
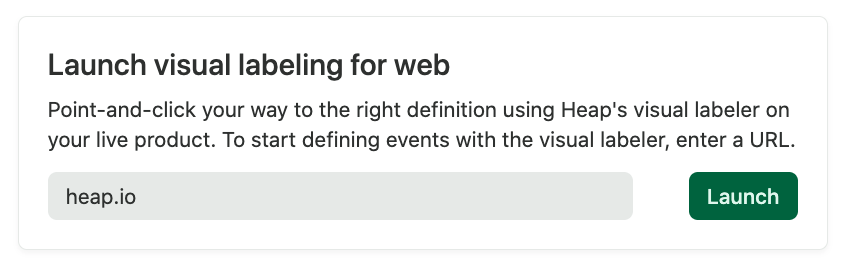
To visually label websites and web apps, navigate to the Visual labeling page in Heap. Enter the URL for your website in the text box, or select one of your top-viewed pages from the drop-down.
Explore pageview suggestions
This section will take you to a list of the most popular pageviews within your app. Labeling pageviews as events allows you to dig into engagement with those pages to better understand user behavior. For more info, see Pageview Suggestions.
Click Launch to launch the visual labeling interface on your selected page. Once it loads, it will look like this:
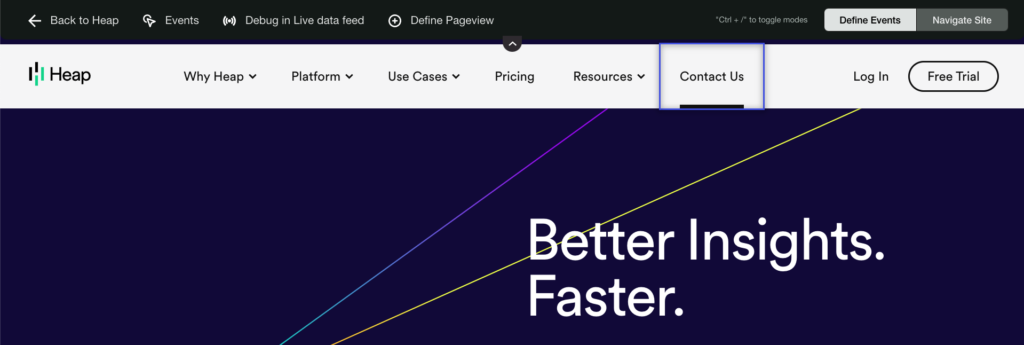
If the visual labeling toolbar is blocking an element you want to label, click the arrow at the bottom to minimize it.
To label new events, hover over and click on the element you’d like to label. Once clicked, a pop-up will appear where you can review and update the label of the event as needed before saving it.
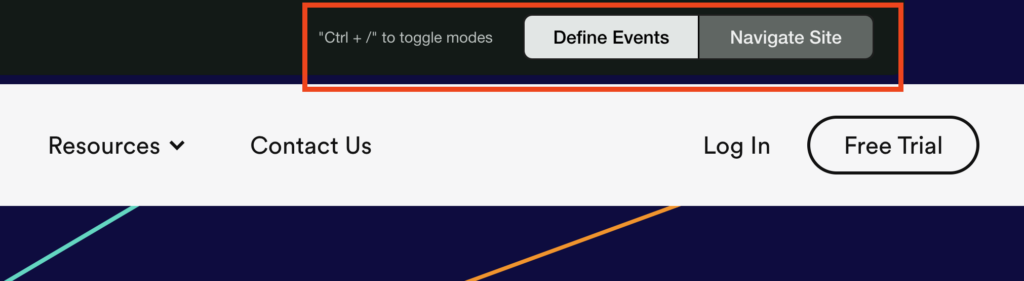
In the visual labeling toolbar you’ll see options to Label Events and Navigate Site. The Label Events mode will allow you to label the event based on your clicks/interactions. The Navigate Site mode allows you to use the site regularly so you can get to the interaction you eventually want to label.
To switch modes you can either click on the mode you want in the toolbar, or use the keyboard shortcut (Ctrl + /). For German keyboards, the shortcut is Ctrl + Shift + ß and for Swiss German keyboards the shortcut is Ctrl + Shift + ‘. The keyboard shortcut is helpful to switch modes without triggering subsequent click interactions on your site.
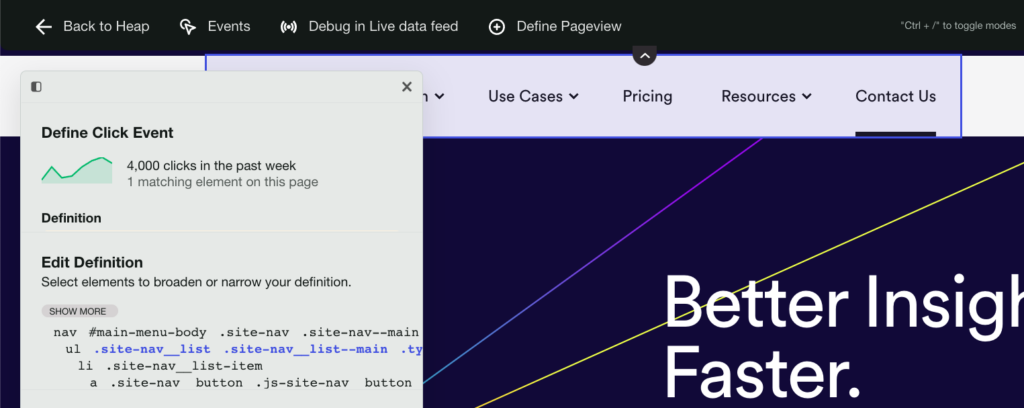
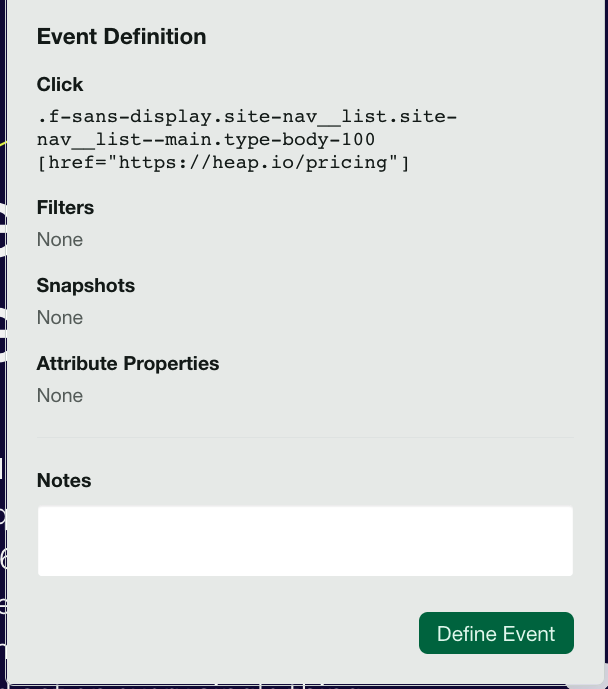
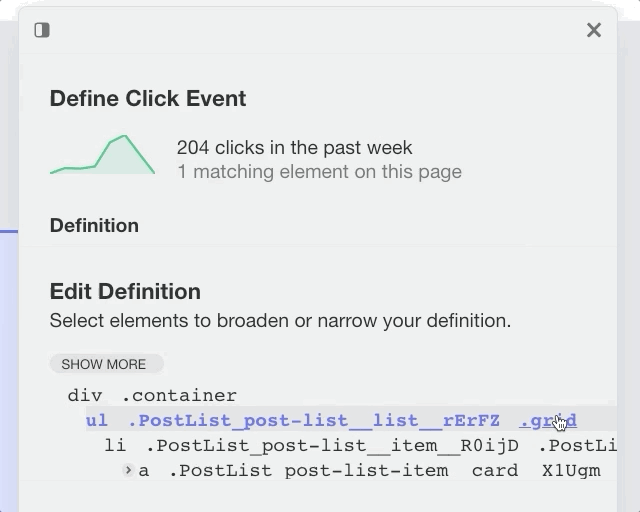
In the screenshot below, we’ve clicked on the Free Trial button on our homepage. To the right, some helpful information is provided which you can review to confirm that you are labeling the right event.
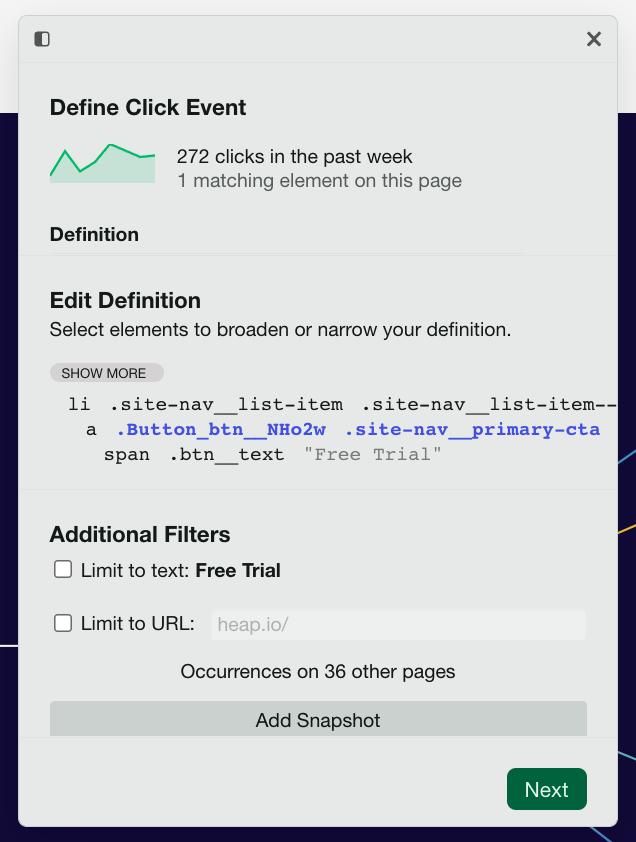
The information listed on this screen includes:
Amount of clicks in the past week: Reference this number to make sure you’ve selected the right event. If it’s one that typically gets a lot of traffic, but this number is low, then you may need to adjust your event criteria.
Number of matching elements on this page: If you intended to select an element that appears more than once, such as a list with multiple elements, you can check this number to confirm your selection is correct.
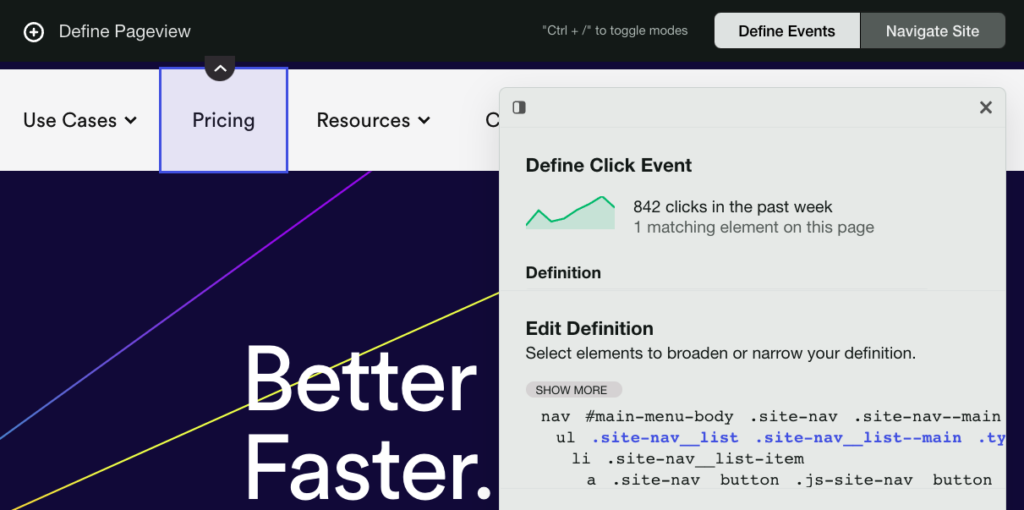
For example, you may wish to know when any element of a navigation bar is selected. You can hover over the navigation bar to select all of the elements in that space.
When labeling an event, you can check the selector to confirm that it applies to the entire nav bar (.site-nav__list in the screenshot above).
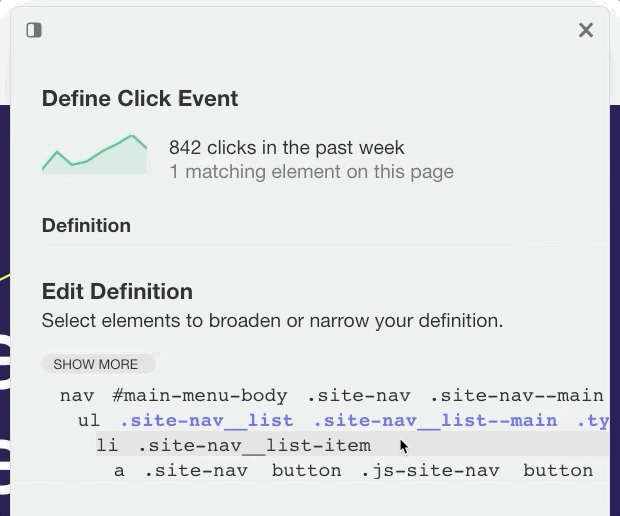
Selecting only one of the navigation bar elements will look like this.
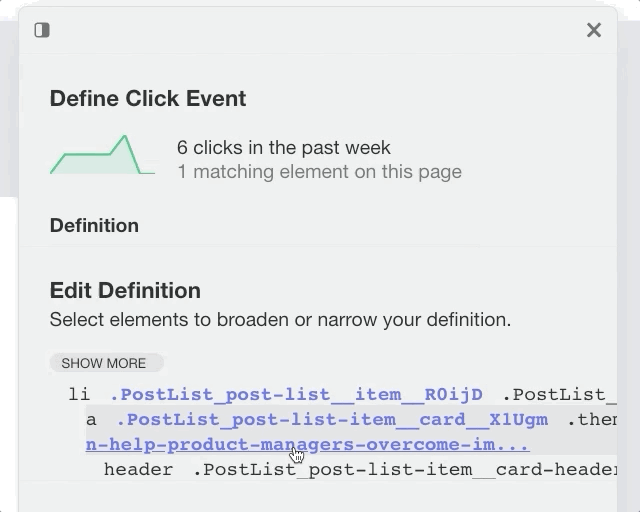
Within the Edit Event section, you can hover over each CSS element to see what it selects on the page. Clicking on an element adds it to your event, enabling you to narrow down the criteria for your new event from this page based on what you want to capture.
Scroll to the right to see the full event criteria.
Clicking on different elements won’t break your event. You can experiment by clicking on different CSS elements to see what gets captured, allowing you to further optimize your new event.
CSS character limit
Heap has a 1024 character limit for parent hierarchy capture and truncation.
If there are too many characters in the hierarchy between the child selector and the parent selector, your definition won’t work.
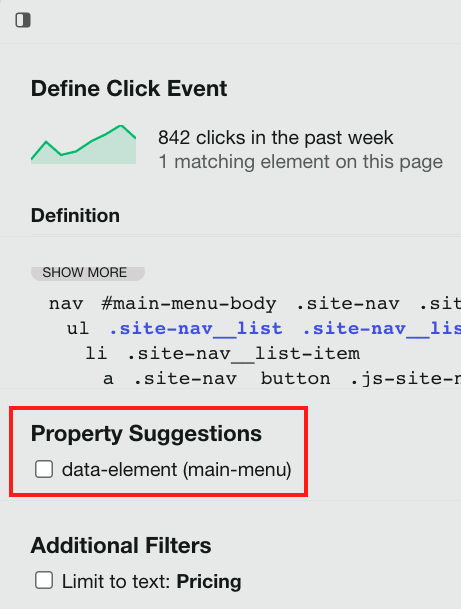
Property Suggestions
If your event includes data attributes, you’ll see an option to add these to your event by selecting the checkbox next to the attribute. This is helpful for adding useful metadata to an event.
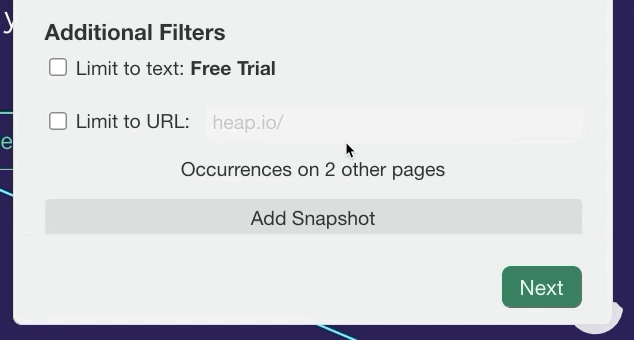
Additional Filters
The following filters may appear based on the context of the event you are labeling.
Additional Filters
Limit to Text: This allows you to narrow the criteria for the event based on the text in the element.
Limit to URL: This allows you to narrow the criteria for the event to only instances where the event occurs on this page.
You may also see warning messages if you are labeling an event that already exists in your Heap account, if there is no data associated with the event, or if the event matches what we know to be a bad pattern (such as being too wide in scope).
Once you’ve tailored your event to your needs, click Next. On the next page, you’ll see options to name and categorize your new event. You can label an event in your personal or shared space.
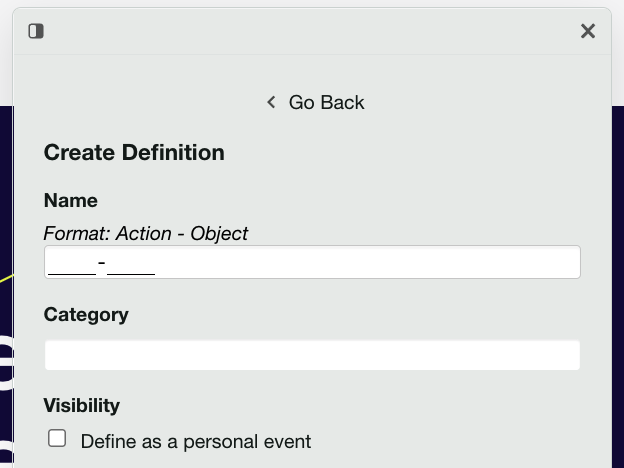
You’ll have the chance to review your event one last time before saving. At the bottom of the page, you can add notes to give a deeper description of what this event is capturing. When you’re ready to save your new event, click Label Event.
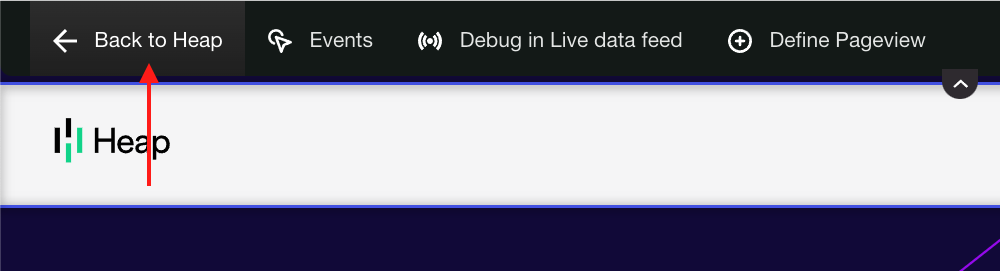
To see your brand-new event, click the Back to Heap button at the top to navigate back to your Heap account. You’ll also see options to QA with Live View and label pageviews in this top navigation bar.
Not familiar with CSS? Take our 30-minute Intro to HTML & CSS course to quickly ramp up to creating and managing your very own events.
Best Practices
When visually labeling events, we recommend the following best practices.
Always select the largest element possible. This includes all clicks that could occur inside the highlighted event.
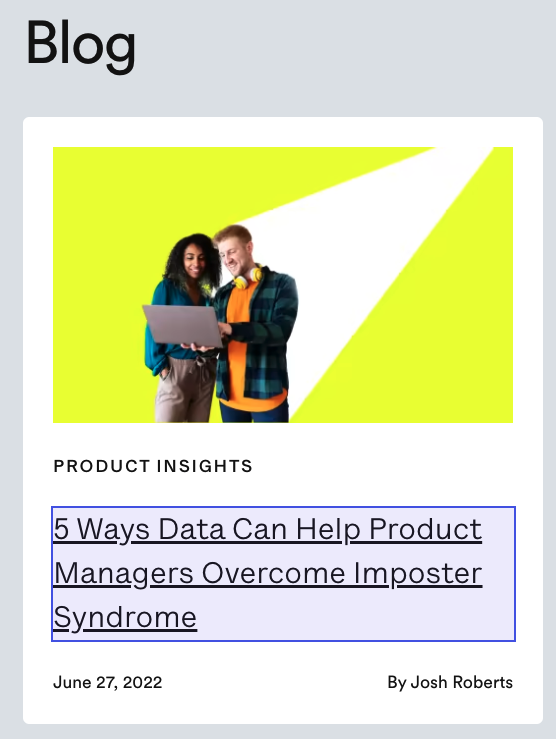
Example: Capture All Clicks on Blog Post CTA
As an example, we may want to capture all clicks on a blog post on your homepage, including clicks on the title, image, and surrounding space within that element. To make sure all of these actions are captured, we’ll select the entire element when labeling the event.
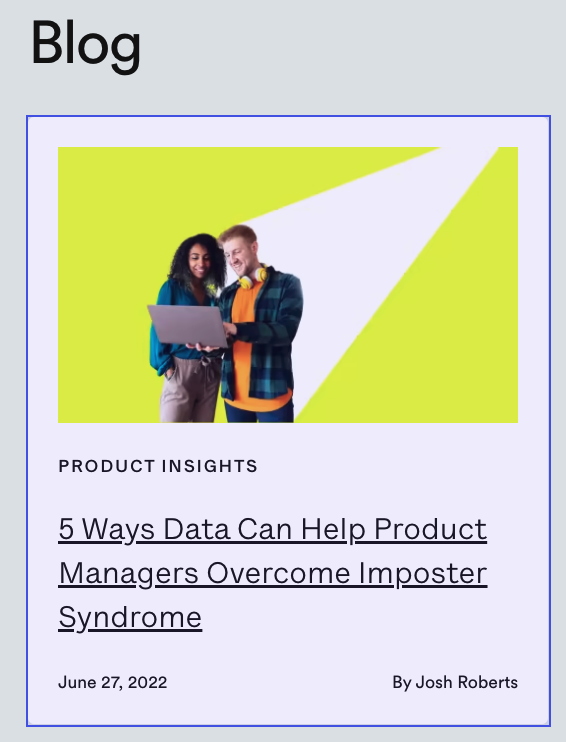
If you label the event on only the title of the blog post, then you’ll miss clicks on the other parts that also lead to that link.
Be careful when using dynamic CSS IDs or classes, which includes most IDs you see with a random string of numbers or classes (such as ember_12345) as these may limit the data captured so much that nothing appears in Heap. If you see no users have completed this action in your analysis, this means you probably have a dynamic CSS class or ID selected.
If too many elements are highlighted when you label your event, you can narrow your event by clicking on CSS elements to add them to your event.
If too few elements are highlighted, you can expand your event to include the elements you want to capture by clicking on them within the edit section.
To better understand how CSS selectors work, check out our guide on Events overview.
Example: Capture Clicks On Signup Wherever It Appears
Many websites have elements that exist on multiple pages, such as a signup button. If an element has the same CSS hierarchy on all pages, then this event will be labeled across all pages.
If you only want to look at the event on a specific page, then make sure to check the ‘Limit to URL‘ box when labeling the event. This makes sure that the event labeled will only apply to the path, and not to all other pages where the same action is taken.
In this example, we highlight ‘Sign Up’ to label it as a new event. To make sure we are only tracking clicks on ‘Get Started’ on this specific page, we check ‘Limit to URL‘.
With that box checked, we don’t have to worry about unintentionally capturing clicks on the same ‘Sign Up’ button on other pages.
Troubleshooting Common Errors
For errors using visual labeling, see our FAQ I can’t get visual labeling to work. Why?
React & Angular Websites
Is your app built in a single page app framework, such as React or Angular? If so, be sure to write distinct classes or IDs or make use of data-attributes so that you can accurately label events based on those selectors.
Browser Compatibility
We only support visual labeling for the latest version of Chrome on desktop. Mobile browsers are not supported. Other desktop browsers, including Firefox, Safari, Edge, and all others, are not supported.
If you are having any trouble with visual labeling on Chrome, you should check to make sure you are on the latest version of Chrome. For steps to do so, see Google’s support documentation.