To make the most of this guide, you’ll need a baseline understanding of key concepts like events, charts, and properties. If you are still learning about Heap (meaning those terms don’t mean anything to you), we recommend taking our Hello Heap course or reviewing our Setting Up Heap guide prior to jumping into this guide.
This guide is meant to be used in tandem with one of Heap’s in-app Dashboard templates (linked in step 0). We recommend having the template and this guide open and working through them side-by-side.
If you’re new to analysis in Heap, we recommend reviewing Create Your First Chart, which covers helpful charts 101 info.
Introduction
We all know that measuring feature adoption can be a bit of a guessing game. Businesses make changes they think will improve the customer experience, but often fall short when it comes to measuring the impact of those features on the user experience.
Knowing if users are interacting with a feature, and how frequently, is such an important part of improving adoption and ultimately retaining customers. Take a look through these charts to get a baseline understanding of how to measure feature adoption and retention!
Step 0: Open the in-app dashboard template
First things first: Open up the in-app dashboard template (linked directly below this line) so that you can complete these steps side-by-side.
In-app dashboard template: Feature engagement & impact
Download our guide and worksheet on Measuring Feature Success to give your team an easy-to-use framework to make data-driven product decisions.
Step 1: Define the inputs needed for this dashboard template
To use this dashboard template, you’ll need to select some baseline inputs. In some cases, you’ll have the option to use a default Heap event or property.
If you need to create a new event or property as part of this process, see our guides on creating new events and properties.
Not sure what to put here? See a list of useful events for eCommerce, SaaS, and Financial Services businesses in the Industry Recommendations section of our Getting Started guide.
| Name | Description |
| Active Usage | A user action that you use to define an active user when counting daily/weekly/monthly active users (choose “Session” if you define an active user as any visitor) |
| Feature Start | An event that captures the first step in a feature workflow |
| Feature End | An event that captures the last step in a feature workflow |
Step 2: Save your new dashboard
This dashboard will be automatically generated as you select your inputs. To save it for future reference, click the Save dashboard button at the top.
Chart Breakdown
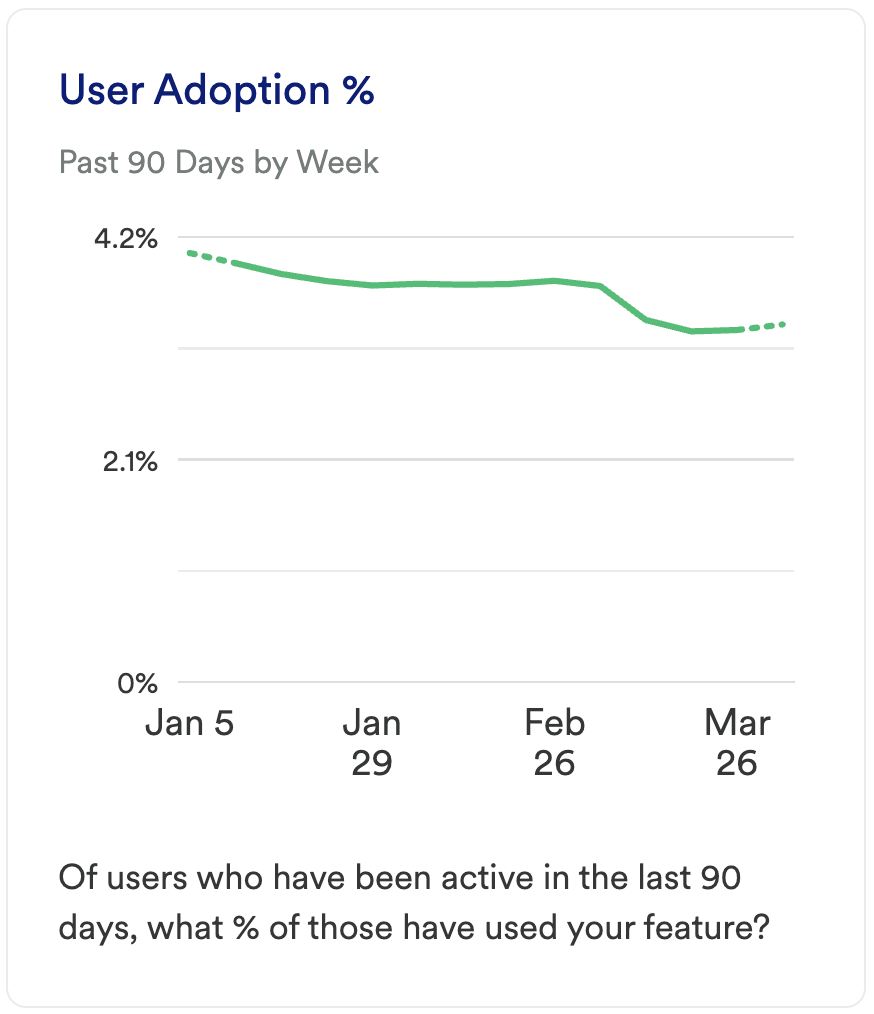
Chart 1: User Adoption %
What does it tell you?
Of users who have been active in the last 90 days, what % of those have used your feature?
How to interpret?
The goal here is to see a high ratio of A to B. This will indicate your active users are engaging with your key feature. The higher the percentage, the higher adoption of the feature among your most valuable user base – the active users!
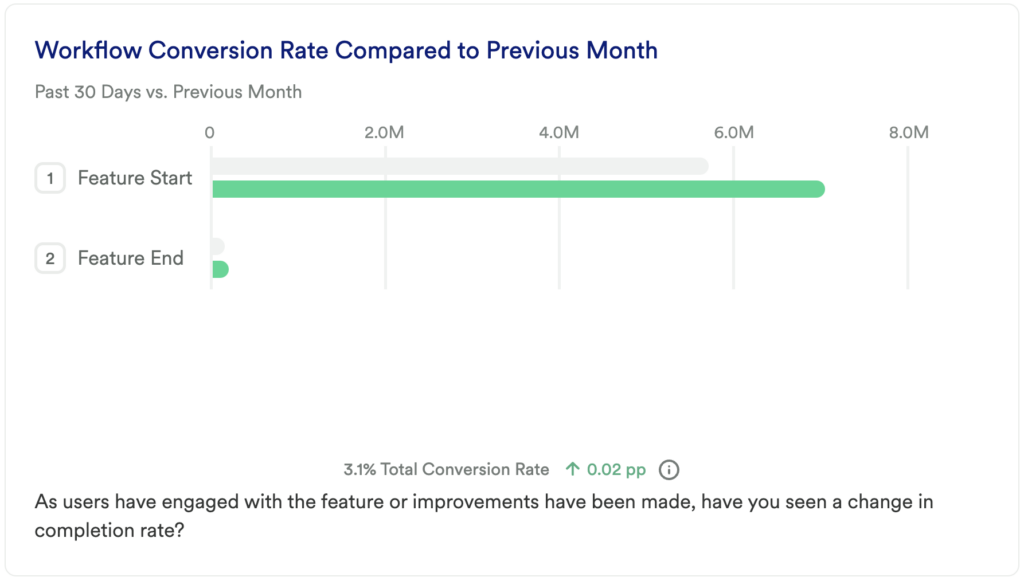
Chart 2: Workflow Conversion Rate Compared to Previous Month
What does it tell you?
As users have engaged with the feature or improvements have been made, have you seen a change in completion rate?
How to interpret?
Here you can understand the baseline conversion rate of your feature usage by looking at the number of individual users who make it from your start event to your end event.
Dig deeper by adding additional steps to this funnel to see major drop-off points. Click into the step with the largest drop off point to do additional analysis.
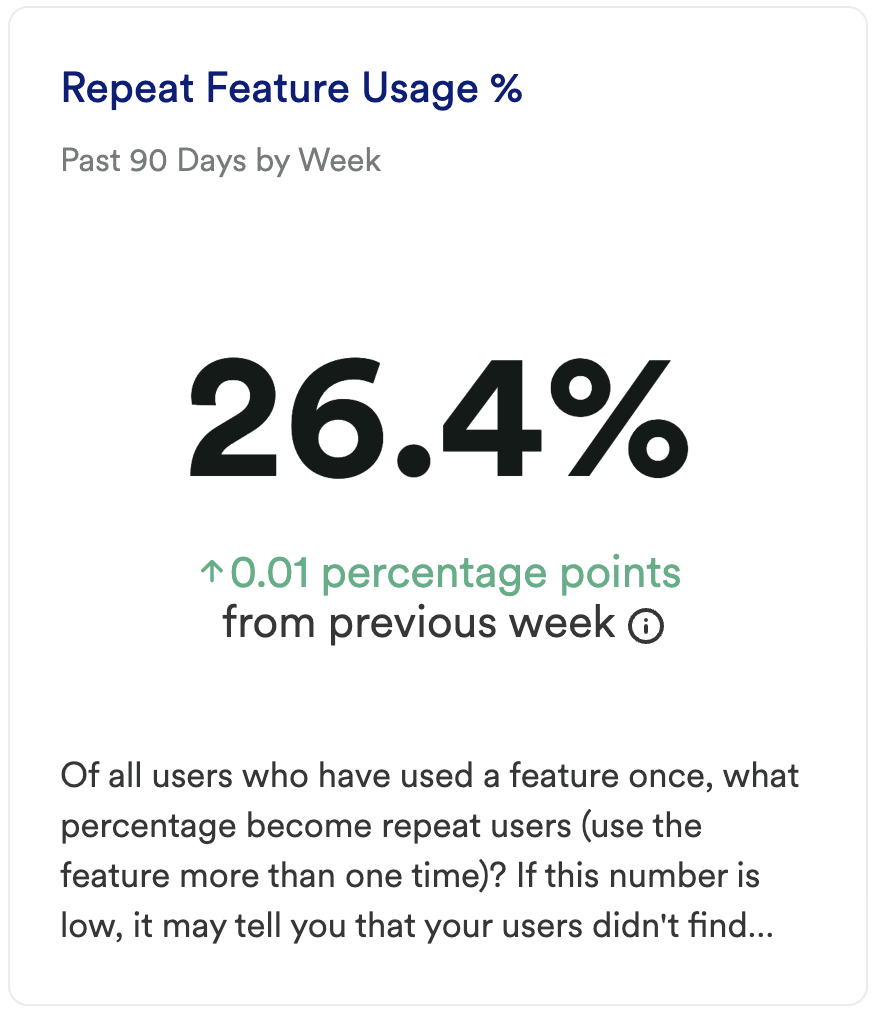
Chart 3: Repeat Feature Usage %
What does it tell you?
Of all users who have used a feature once, what percentage become repeat users (use the feature more than one time)?
How to interpret?
You want to see a high ratio from A to B. If high, this indicates users are continuing to come back. If this number is low, it may tell you that your users didn’t find obvious value in your feature after trying it out.
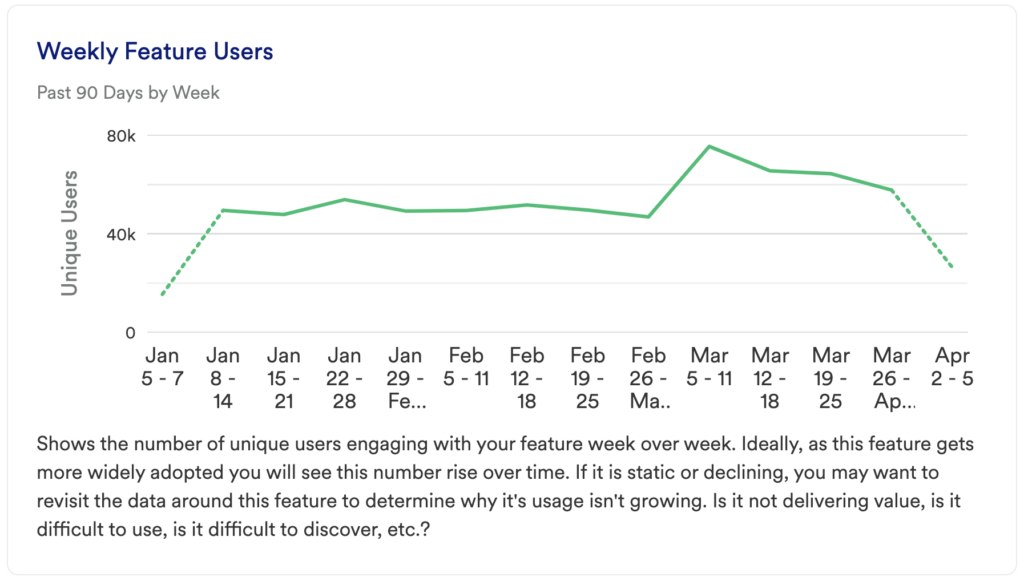
Chart 4: Weekly Feature Users
What does it tell you?
Shows the number of unique users engaging with your feature week over week.
How to interpret?
Ideally, as this feature gets more widely adopted you will see this number rise over time. If it is static or declining, you may want to revisit the data around this feature to determine why its usage isn’t growing. Is it not delivering value, is it difficult to use, is it difficult to discover, etc.?
Chart 5: Power Users
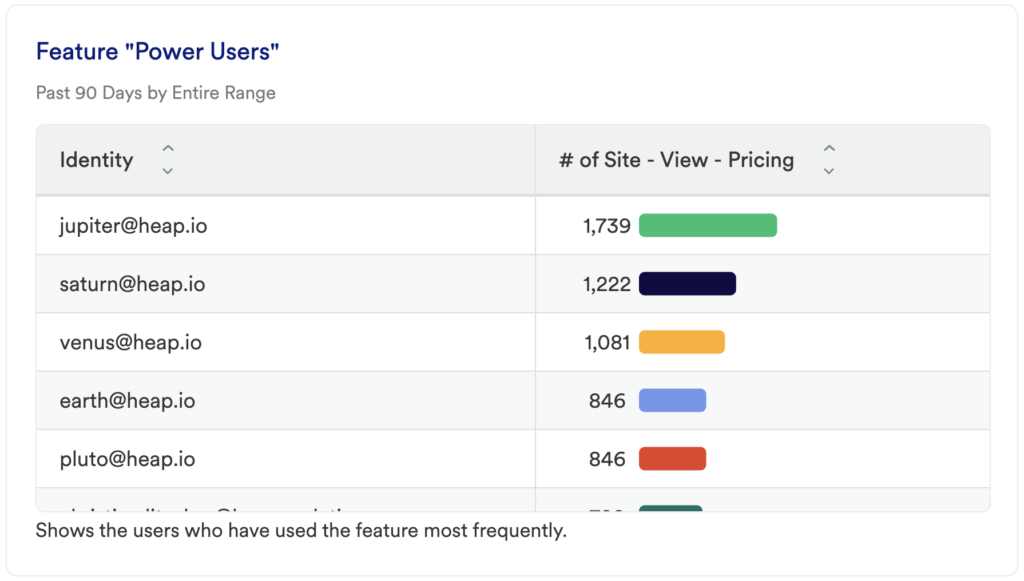
What does it tell you?
Shows the users who have used the feature most frequently.
Chart 6: Feature Retention
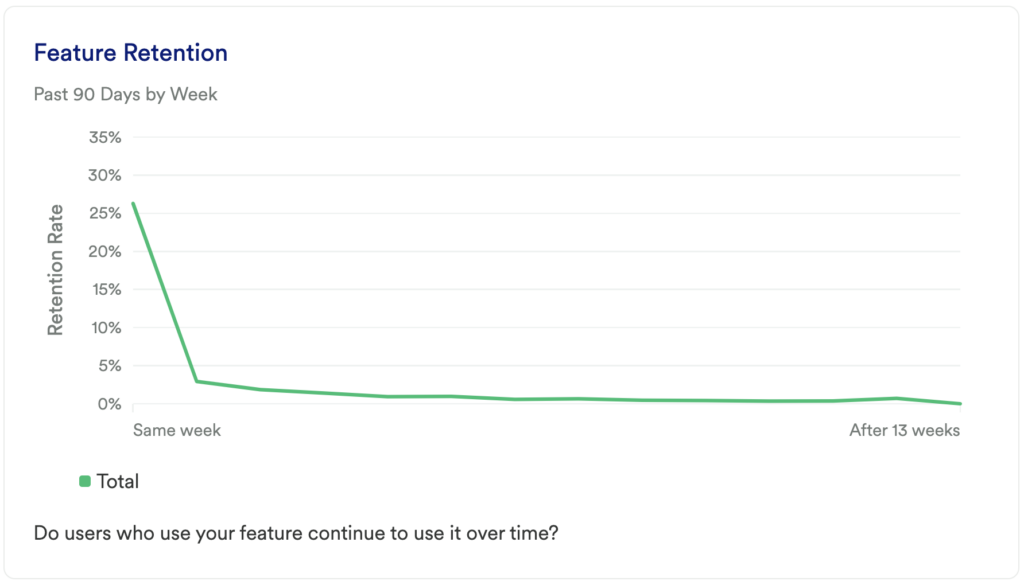
What does it tell you?
Do users who use your feature continue to use it over time?
How to interpret?
If you see a large dip at the start of your chart, don’t panic! This is normal, especially as users are becoming acquainted with your tool or site. The key here is seeing improvement over time and to have an upwards trend after any initial fall-off.
Chart 7: Which users are engaging with my feature?
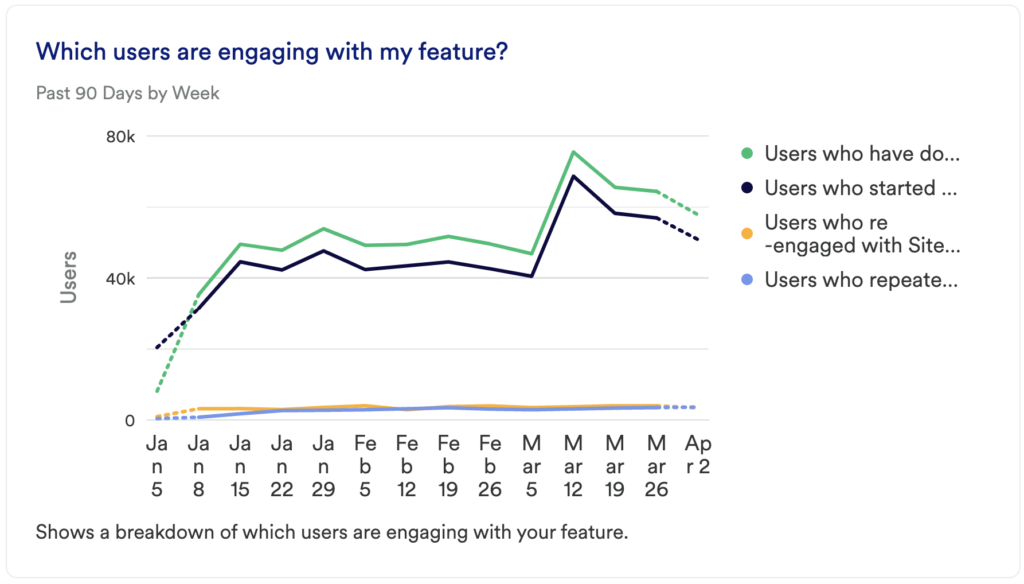
What does it tell you?
Shows a breakdown of which users are engaging with your feature.
How to interpret?
Do you notice any surprising dips or spikes among user groups? Do these numbers align with any product changes or marketing efforts?
Use filters and group bys to identify who these successful users are and run additional analysis. Do they fit into any particular user segments or demographics? What actions are they taking that your less successful users aren’t?
Step 3: Take action
Measuring feature adoption is one of the primary goals of any product team. It is just as important to understand what your users are finding valuable as it is what they don’t find valuable.
Throughout each of these above charts, it will be important to look at the segments of users who are and are not interacting with certain features and adjust accordingly.
If you are finding there is little adoption of your feature, take a deeper look into where drop-off is occurring in the usage funnel, or even try to A/B test walk-through guides.
Then, keep measuring! This is an iterative process. Get the data, look for insights, take action, then go back to the data to measure the results of your work!
In conclusion
Adoption of a feature is one of the primary points of measurement for any business looking to ultimately retain its customers. Knowing if features are being adopted shows a continued value in your tool and ideally results in a lifelong customer base!
As a quick way to get started measuring impact, Heap’s impact calculator allows you to measure the potential impact of any change so you can compare the value of different initiatives you’re considering. To learn more about how the calculator works, read our best practice guide.