Identifying accounts that are likely to churn as early as possible is crucial to intervening to save those accounts. To identify high-risk accounts, you’ll want to understand which accounts have very few users who are using an important feature or KPI.
To see this, complete the following steps:
1. Navigate to Analyze > Usage over time
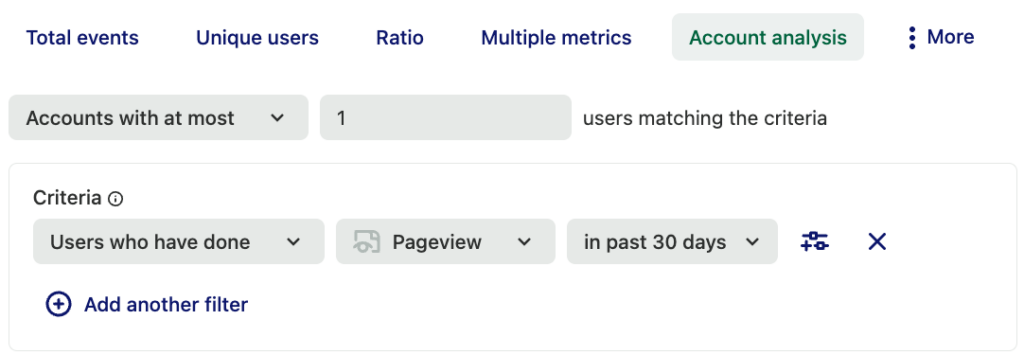
2. Select More > Account analysis
3. Set the chart to Accounts with at most > 1 users matching the criteria
4. Set the criteria to Users who have done
4. Select the event you use to define activation. This could be your autocaptured sessions or pageview event, or something specific, like a click on a certain button. In this example, we’ll use the pageviews event.
5. Set the time frame to in past 30 days or to another time frame depending on how you define at-risk accounts. Your chart should look like this.

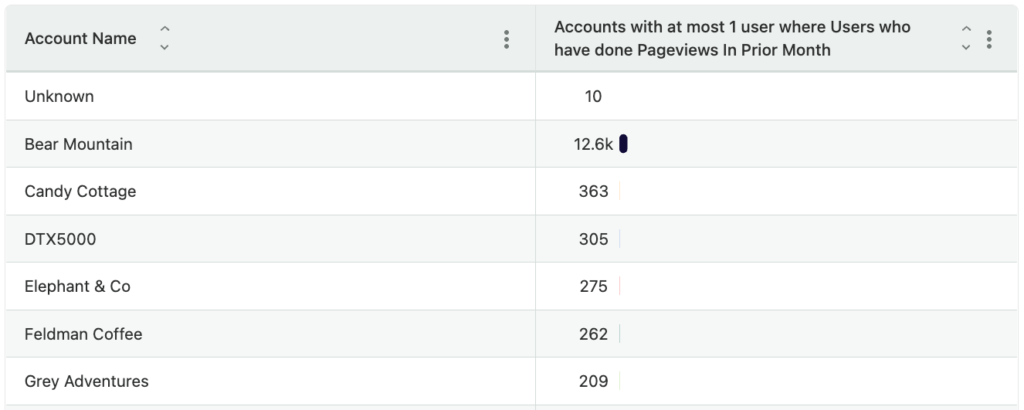
6. Add a group by for Account Name. In our case, we use our Salesforce Integration to automatically send this info to Heap.

7. Set the date range at the bottom to group by Entire range, or a different value depending on what level of granularity you are looking for.

7. Click View results to generate a list of which customers are only completing this KPI 1 or 0 times. Your account management team can use this information to assess these customers to get them re-engaged.
You can use the chart type drop-down to update the chart type to Table chart to make this an easy-to-read list of account names.

For more information on how to use Heap to measure and grow your accounts, see Account Health Analysis.