Tracking account-based key performance indicators (also known as KPIs) is crucial to quickly spotting trends and opportunities to nurture accounts in a way that will support those KPIs.
To track a KPI at the account level, set up a chart as follows:
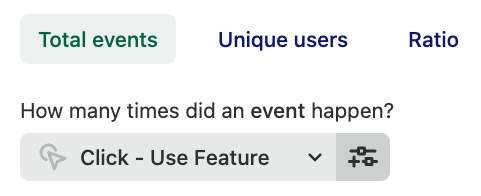
1. Navigate to Analyze > Usage over time and make sure you’re on the Total events tab
2. Select the event for the KPI you are interested in. For example, if you’re a SaaS business, a click on a certain button in your app might be your KPI.
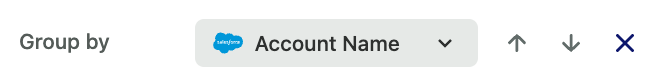
3. Add a group by and select a property for account name. At Heap, we use our Salesforce Integration to automatically send this info from Salesforce into Heap.
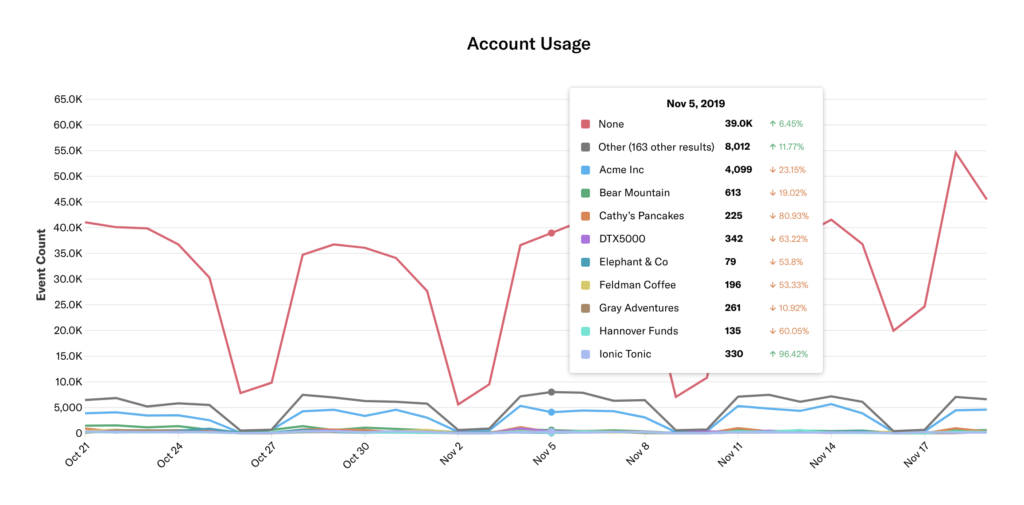
4. Click the View results button to generate a chart of which customers completed this KPI the most. You can use this information to identify your top customers.
For more information on how to use Heap to measure and grow your accounts, see Account Health Analysis.