For info on how to calculate the median time it takes users to complete an event, see Usage Interval Analysis.
Average time between in Heap measures the average time it takes for a user to complete Event 2 after performing Event 1.
Example: A designer for an eCommerce site must determine whether or not the user experience for adding a product to a cart is intuitive for users. To get a sense of this, they want to measure the average time it takes for a user to look at a product page (PDP page) and then add an item to the cart. When reviewing our data, we see 3 users who performed the following actions:
User 1: View PDP 10:00, Click Add to Cart 10:05, View PDP 10:15, View PDP 10:16
User 2: View PDP 11:00, Viewed PDP 11:05, Click Add to Cart 11:20
User 3: View PDP 10:00, Click Add To Cart 10:05, View PDP 10:10, Click Add To Cart 10:20
To calculate the average time, we look for AB pairs, meaning sets of users who completed Event 1 and Event 2 together. In this example, User 1 has 1 AB pair that took a total time of 5 minutes.
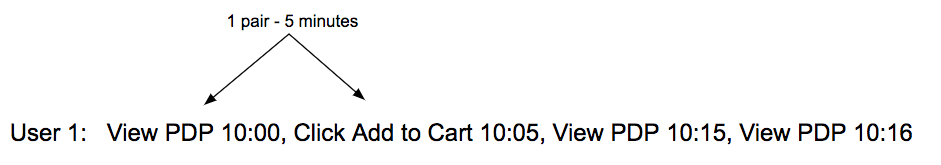
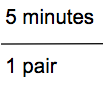
When, calculating the average of the AB pairs, 5 minutes goes in the numerator to calculate our total duration, and 1 will go into the denominator to represent one AB pair.
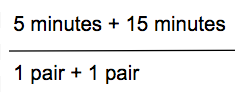
User 2 also has one AB pair:

Which means we can update our equation as follows:
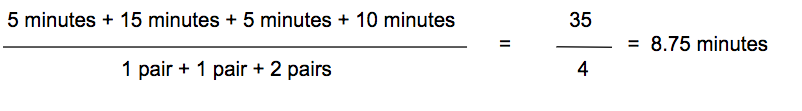
User 3 performs this set of actions twice, so they have 2 pairs:
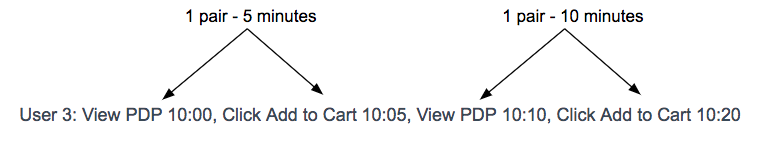
Using this information in our equation, the average time for this particular set of users is 8.75 minutes.
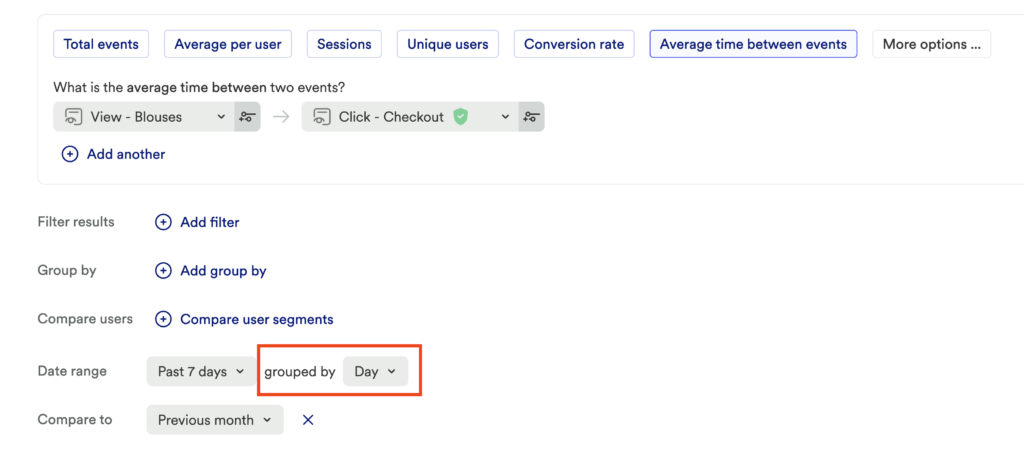
Date range group by
When graphing the average time between two events in Heap, the granularity that you choose (ex: hour, day, week) determines the conversion window that’s used to calculate the average time between the events.
For example, if you set the granularity to group by day, the chart will show the average time between events where the second event was completed within one day of the first event.
To learn more, see Why do values in my analysis change when I change the date range?