Overview
The influence chart in Heap allows you to analyze what behaviors or marketing channels have influenced behavior of interest. This helps you answer questions like:
- Should I invest more in my email marketing efforts, my ad campaigns, or my website content?
- Which user actions have the biggest impact on my marketing efforts?
Check out the chart template Which collections pages impact my total revenue? for an example of how to use the influence chart. Note that the Shopify integration is required to run this chart.
To set up Heap Connect queries equivalent to this chart type, see Attribution.
Setting up an influence chart
Navigate to the Analyze page and click the More button to see the influence chart option.
In the example below, we’ve combined Shopify transaction data, on-site behavioral data, marketing channel referral data, and email interaction data from SendGrid and HubSpot to determine what paid marketing efforts influenced conversions and revenue for our highest-paying customers who have a LTV (or lifetime value) greater than 10,000.
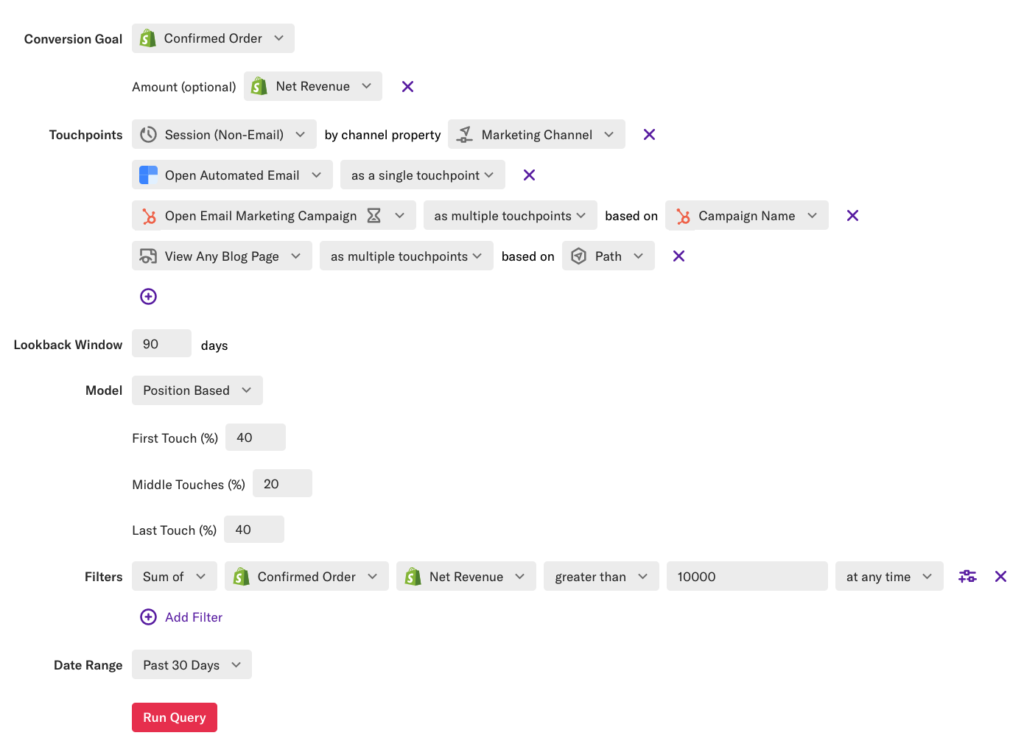
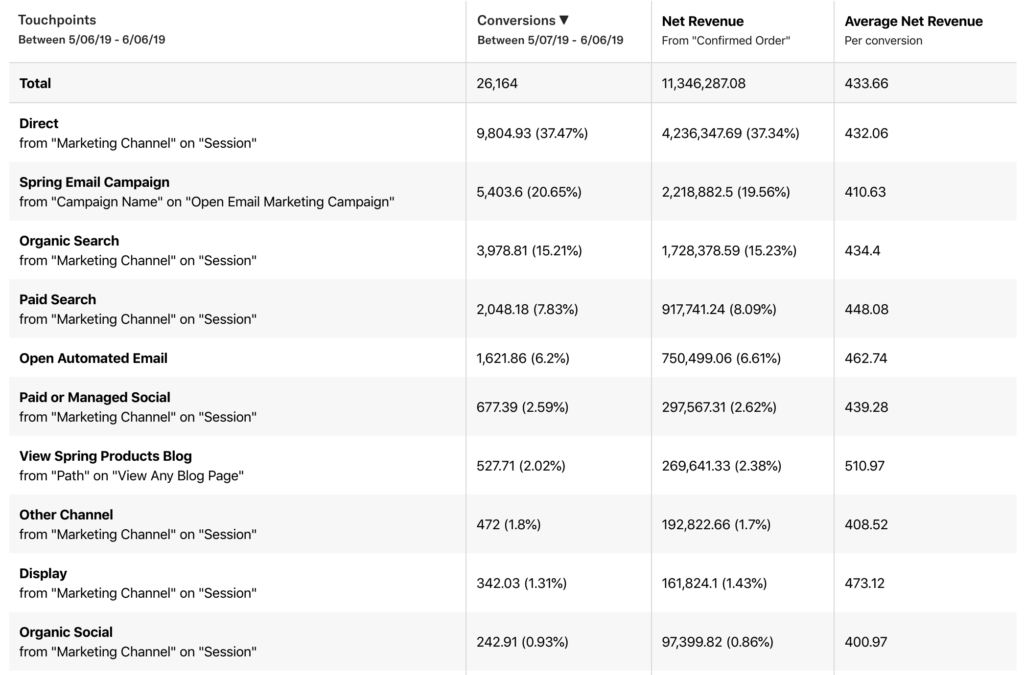
For our example, when building this chart, we decided to weight the touchpoints that a user performed before making a purchase to give more conversion credit to the first and last touches. Based on this analysis across all marketing channels, we learned the following:
- ~21% of conversions were influenced by a recent email marketing campaign
- ~8% of conversions were influenced by paid search
- Hardly any conversions (~2%) were influenced by content marketing efforts on the blog (though conversions influenced by the blog have an average order value that’s $100 greater than other channels)
Do you want to measure the influence of your marketing efforts and features, but don’t know where to start? This guide provides a walkthrough of how to use the building blocks of an influence chart to start answering these questions.
Building An Influence Chart
The influence chart requires the following chart parameters to properly determine the influence of the behaviors and channels that drive your conversion goals:
- Conversion goal
- Touchpoints
- Lookback window
- Model
- Date range
The following optional parameters can be set for better insight into your performing behaviors and channels:
- Amount Property (on Conversion Goal)
- Channel Property
- Touchpoint Grouping Property
- Model Custom Weighting
- Filters
Note that the influence chart only counts the first conversion event per user in the date range.
Conversion Goal
The first step in building an influence chart is to create the goal event of interest. Often, this conversion goal will line up with a “Sign Up” or “Purchase” event in Heap. However, you can provide any event that you’d like to determine the influence that user behavior or marketing efforts may have had on a user who was on their way to performing a conversion goal event.

Optional: Amount Property
Once a conversion goal has been set, you’ll be prompted to provide an optional Amount property, which is designed to correspond with a revenue property on the conversion goal event. If set, Heap will calculate the revenue amount that was influenced by each touchpoint, as well as the average revenue per conversion for each touchpoint. If left blank, Heap will only calculate the number of conversions that were influenced by each touchpoint.

Touchpoints
Touchpoints refer to the event behavior that you want to attribute conversions and revenue to. Like conversion goals, a touchpoint can be any event available in your Heap account, or any future event that you create.
When determining whether a touchpoint influences a conversion, Heap takes the following parameters into account:
- Touchpoint type (a session or an arbitrary event)
- Lookback window
There are two types of touchpoints: 1) session event touchpoints and 2) arbitrary event touchpoints.
Session Event Touchpoints
The default touchpoint in the influence chart is a session, which can be used to determine the influence of referral channels that turned a visit or session into a conversion.

When a session event touchpoint is selected, Heap requires that you provide a Channel Property that determines how your channel groupings for referring channels should be aggregated. You can provide any session level property (UTM Medium, Referrer, etc.) as a channel property, though we recommend that you provide a property that maps to your specific channel criteria. Heap will automatically select a default property for you if you have an applicable property with the word “Channel” in the name.
If you aren’t familiar with channel property labels or do not have a channel property available in your account already, check out the Labeled Properties section of our Properties guide for steps to set one up.

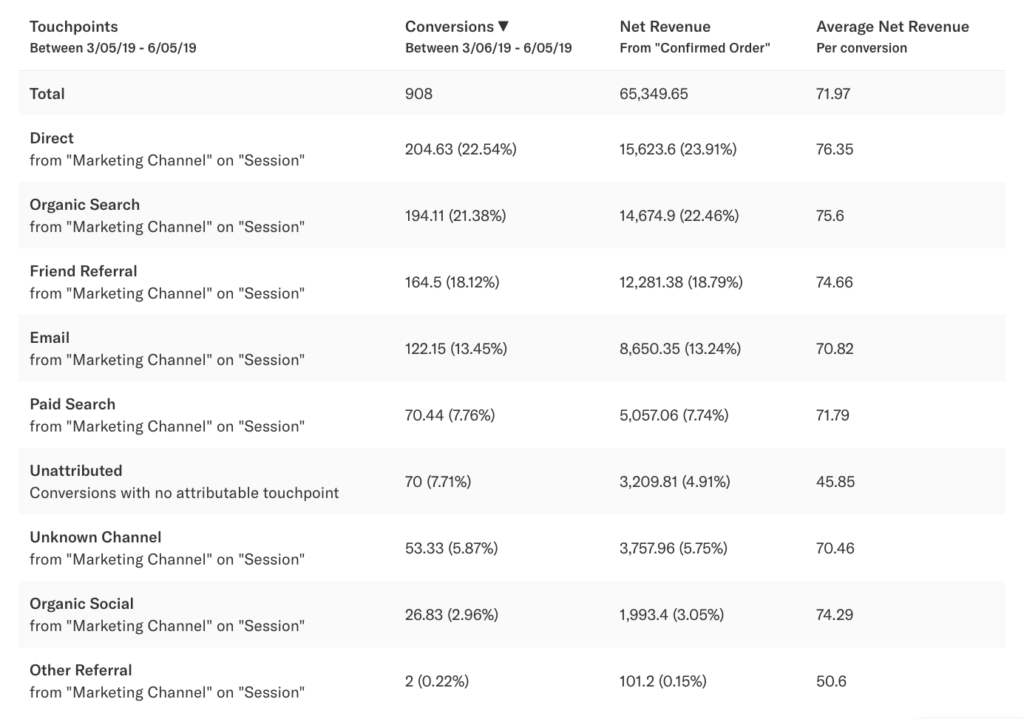
As an example, if I included a Session touchpoint aggregated by the channel property “Marketing Channel”, I would get the following result. You can see that the touchpoints in the resulting chart are the channel criteria from the labeled property “Marketing Channel” on the “Session” event.
If you’re looking to combine Session-level influence with off-site events that drive a user to a session (such as opening an email), you’ll need to make sure that you create a new session event that does not include the referral traffic from this source. This is important for avoiding double counting touchpoints from the same source, such as open email and start session from email. To do so, navigate to the Data > Labeled events page and create a ‘Start Session’ event filtered to exclude referrals from a particular source, such as ‘UTM Medium does not equal Email’.
Arbitrary Event Touchpoints
Heap also allows you determine the influence of any events that happened before a conversion goal so that you can see what behavior actually drives conversion outcomes, rather than what referral channels. You can include additional event touchpoints by themselves, or in addition to Session type touchpoints.
There are two ways you can analyze non-session events as touchpoints: either as a single touchpoint, or as multiple touchpoints.
Events as a Single Touchpoint
You might want to determine what influence reading your website content or opening your emails has on your conversion outcomes. To answer these questions, we’ll need to incorporate events that correspond with these actions as touchpoints in our chart. For this example, we’ll investigate how to determine the effectiveness of our content articles.

If I specify this event ‘View Any Article’ as a single touchpoint, we’ll be measuring the influence of this event as a whole rather than the type of content or the specific article that a user was viewing. If we included this event only in our analysis, we would get the following result:
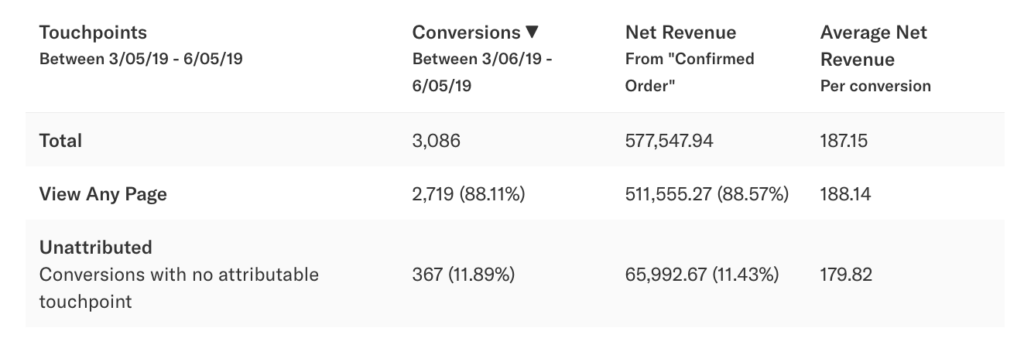
As shown above, this chart demonstrates that 88% of conversions (based on only this touchpoint) were influenced by a user viewing any marketing article, and that 12% of users are unattributed. This means that 88% of users viewed any article before converting during this time period, and 12% of users did not. In general, unattributed behavior refers to conversions that occurred during the conversion goal time period where one of the specified touchpoints was not performed by a user before the conversion goal in the lookback window.
Events as Multiple Touchpoints
The previous result indicated that viewing our article content is a typical action taken by users on their way to purchasing. But what if I want to understand what types of articles or what specific article can be influenced by the highest number of conversions? To do so, we’ll need to break down the event touchpoint into multiple touchpoints based on a property available on this event.
In the example below, we’ll set the View Any Article event to be broken down into multiple touchpoints based on the Content Category of the article. In our dataset, Content Category is a property based on the path of the article, though we can select any event-level property to break out our touchpoint (path, title, custom properties, etc.).

When specifying this event as multiple touchpoints, the resulting chart will show us what content types influenced conversions:
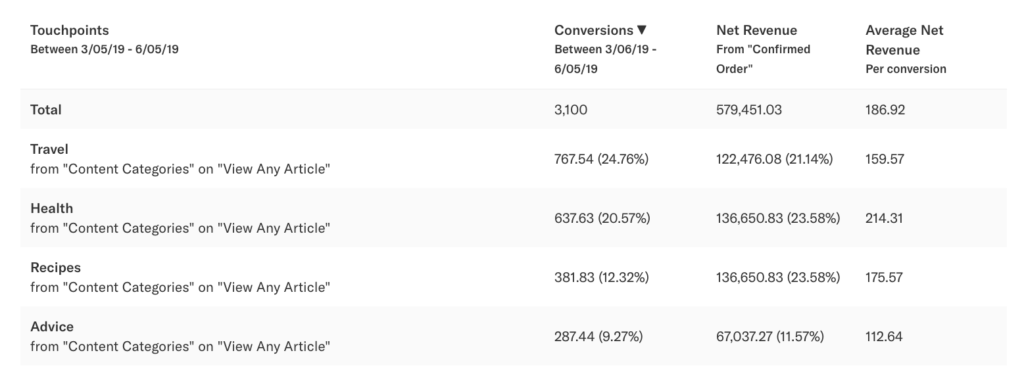
In this example, ~25% of conversions in this model were influenced by Travel content, ~20% of conversions to Health content, and so on. It also looks like conversions that were influenced by Health content have a much larger average order value.
Lookback Window
After specifying Influence touchpoints, you need to determine the time frame during which these touchpoints could have occurred. In Heap, we refer to this as the lookback window, which is the time (in days) that precedes the time of the conversion goal event.

In this example, the effective touchpoint date range would be 12/21/18 – 3/27/19 if my conversion goal date range is set to 3/21/19 – 3/27/19 and my lookback window is 90 days. These date ranges are reflected in the resulting chart.

Model
The model selected for an influence chart determines how conversions (and revenue) are allocated to the influence touchpoints. Heap offers the following models as options for weighting your conversions and revenue:
- Last Touch
- First Touch
- Linear
- Time Decay
- Position Based
Note that Last Touch and First Touch models only consider the last or first touchpoint selected, respectively. In comparison, the other models will incorporate all of the specified touchpoints that occurred before the conversion goal in a multi-touch model.
Last Touch
In the Last Touch model, the last touchpoint before conversion receives 100% of the credit for a conversion and the associated revenue.
First Touch
In the First Touch model, the first touchpoint before conversion receives 100% of the credit for a conversion and the associated revenue.
Linear
In the Linear model, all touchpoints before conversion receive equal credit for a conversion and the associated revenue. For example, if a user had 4 touchpoints occur before a conversion goal, Heap would credit each touchpoint with 25% of that conversion.
Time Decay
In the Time Decay model, touchpoints that occur nearest to the time of conversion receive more credit, determined through an exponential decay calculation. The Time Decay model requires a half-life (in days) to be specified (with a set default of 7 days) that determines how touchpoints are credited based on time. The default half-life of 7 days means that a touchpoint occurring 7 days before a conversion would receive 50% of the conversion and revenue credit, whereas a touchpoint occurring 14 days prior would receive 25% of the credit.
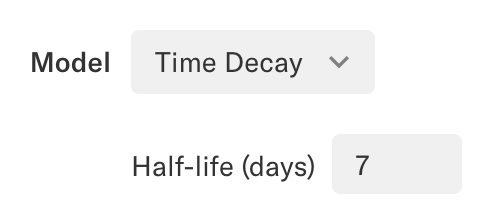
More specifically, for a given event which occurred n days ago, with a half-life of h, it’s “base weight” is 2^(-n/h). This means if an event occurred exactly h days ago, it’s base weight is 2^-1, or 50%. The actual weighting applied in the resulting chart is all of the base weights normalized to 1. For example, if a user had three touchpoints with calculated base weights of 0.5, 0.5, and 0.3, these base weights would add up to 1.3, which is more than 1. These touchpoint weights are then normalized to contribute to exactly 1 conversion, so the normalized weights of these touchpoints are 0.5/1.3, 0.5/1.3, and 0.3/1.3, respectively. These are 0.3845, 0.3845, and 0.231, which sum to 1 and preserve the same relative weight (0.5 is 1.66x more than 0.3, 0.384 is also 1.66x more than 0.231).
Position Based
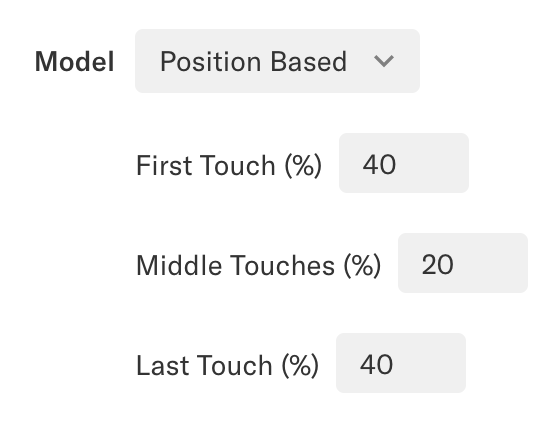
The Position Based model offers the ability to customize how different touchpoints are credited based on where they occurred in the customer lifecycle. The Position Based model allows you to assign how much credit is allocated to the first touchpoint, how much credit is linearly attributed to all middle touches, and how much credit is allocated to the last touchpoint. By default, Heap assigns a 40/20/40 distribution to the position-based model, though you can select any custom weighting, as long as it adds up to 100%.
Date Range
Last but not least, for all influence charts, you’ll need to set a date range that defines when the conversion goal of interest occurred. You can specify any time period of interest, similar to other date range selections in Heap.

Optional: Filters
You can also apply filters to restrict which types of users are included in the chart out of the entirety of all users that completed that conversion event. The filter selection is similar to other filters throughout Heap: you can filter based on user properties, user behavior, segment, and more.