From mid-March to early November, you may spot irregularities in your Heap report visualizations. This is usually related to daylight savings time.
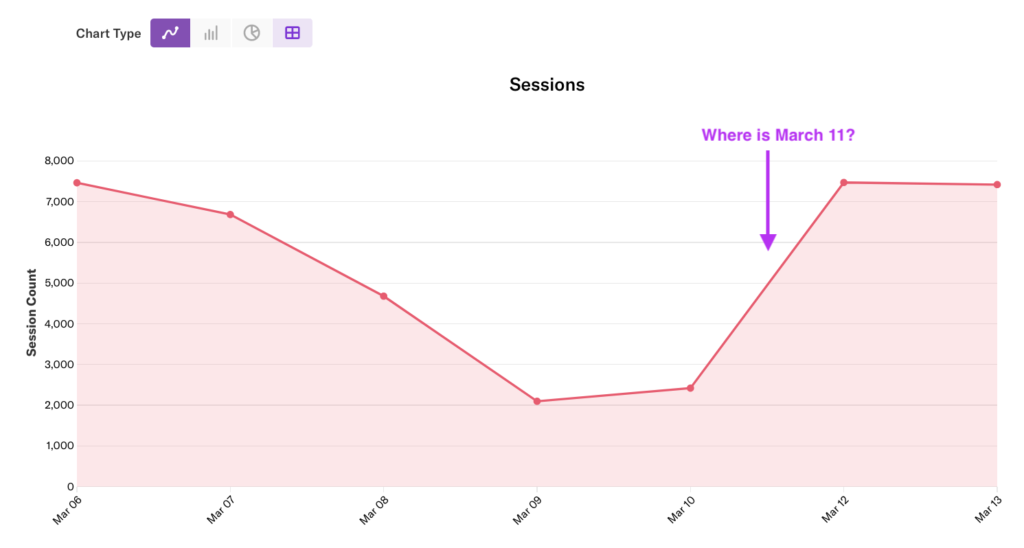
When daylight savings time begins, data is still ingested relative to the UTC standard. For example, in 2018, March 11 was the day when clocks went forward one hour. In the screenshot below, you see the effects of this on all reports that include March 11, 2018.

March 11 appears to be missing. The root cause is that the dates leading up to March 12 are offset by one day. So March 11 is labeled as March 10, March 10 is labeled March 9, etc.
The JSON output for this chart is provided below. The time values use ISO 8601 format and contain the time zone. When March 11 starts, the time zone is UTC-8 hours. After 2 hours, it shifts to UTC-7 hours (when the clocks go forward). The combined effect of Heap allowing users to manage their own time zones and the shifting offset from UTC throws off the labeling leading up to March 11.
"data": [{
    "time": "2018-03-05T08:00:00.000Z",
    "value": 0
  }, {
    "value": 1,
    "time": "2018-03-06T08:00:00.000Z"
  }, {
    "value": 5,
    "time": "2018-03-07T08:00:00.000Z"
  }, {
    "time": "2018-03-08T08:00:00.000Z",
    "value": 0
  }, {
    "time": "2018-03-09T08:00:00.000Z",
    "value": 0
  }, {
    "value": 1,
    "time": "2018-03-10T08:00:00.000Z"
  }, {
    "value": 1,
    "time": "2018-03-11T08:00:00.000Z"
  }, {
    "time": "2018-03-12T07:00:00.000Z",
    "value": 0
  }]
When querying data that includes the date of daylight savings time boundary, take this into consideration. The best solution is to query ranges separately: the period up to the date, and the period after the date.