You can set up a usage over time chart in Heap to measure customer lifetime value (CLV) aka the total revenue generated by a customer.
As a starting point, you’ll need to be sending purchase data into Heap via our APIs or integrations. See our track purchases guide for guidance on these options.
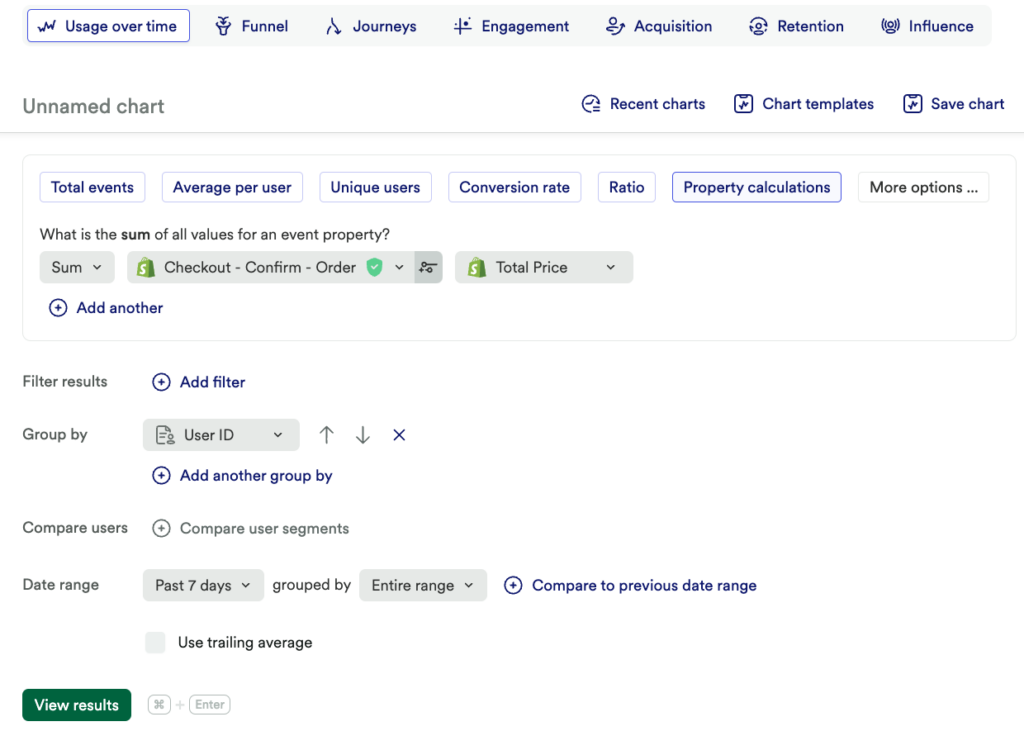
Once you have this data in Heap, complete the following steps to set up your chart:
- Navigate to Analyze and make sure Usage over time is selected at the top
- Select Property calculations (you may need to click More options…)
- In the drop-down that appears, select Sum
- In the next drop-down, select the event that corresponds to a purchase
- In the event property drop-down, select the property that corresponds to total price
- Add a group by and select the property that corresponds to user/customer ID
- For the date range, select your preferred time frame grouped by Entire range (or whichever duration you’d like to measure)
Your completed chart setup should look something like this:

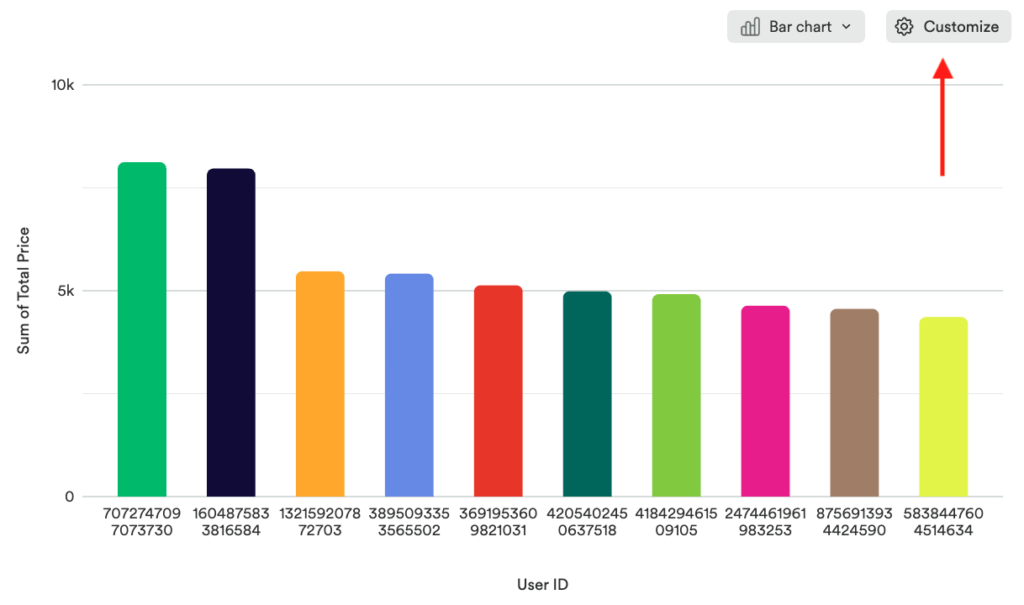
Your chart results will give you a list of customers by lifetime value. You can adjust the chart type via the drop-down for different visualizations, or hover over each bar to see details for each user.
You can also click the Customize button to make adjustements as needed, such as hiding ‘Other’, changing the colors, and more.
