Depending on what you’re analyzing, as you look at the later cells to the right, the number of users who have completed the first time event may drop. This is because the number of users counted in each cell varies based on their event start date.
For example, we may be analyzing the use of a specific tool over the past year, where each cell represents a month in that year. Users who haven’t been using that tool for over a year won’t be included in these later cells, because that time hasn’t passed for those users yet. So if a user started using the tool 6 months into that year, then they wouldn’t be counted in the cell that represents users who have used the tool for 7-12 months.
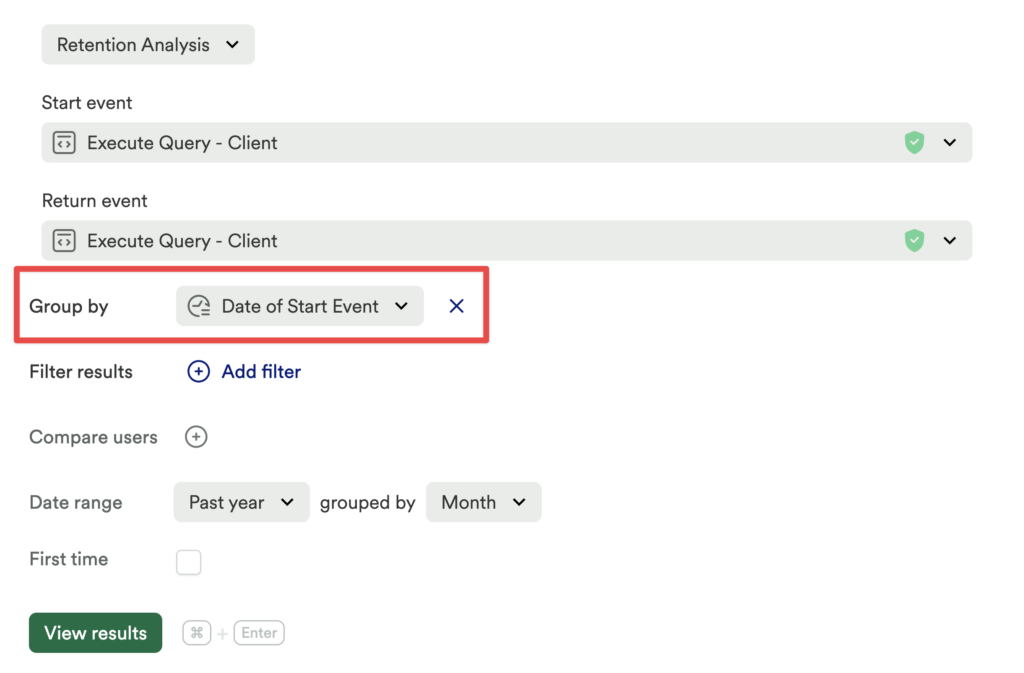
To make this a little more clear, try grouping these users by the date they completed the start event using the group by modifier Date of Start Event.

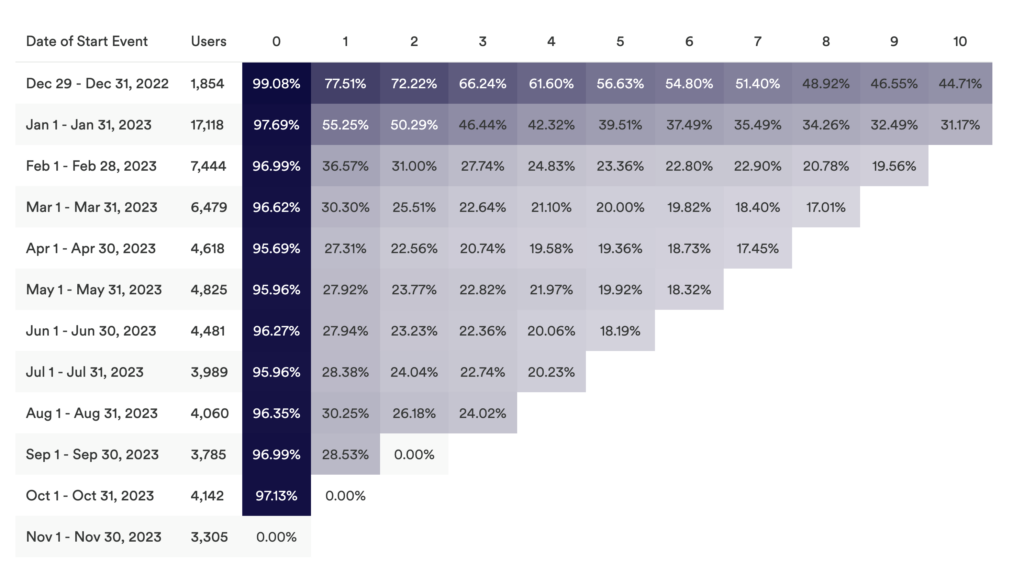
The resulting report will update with the time window of the start event listed next to each row. You’ll notice that the amount of cells listed for each row decreases by one in each row until the last row only has one ‘0’ cell.

Each cell in that row represents the number of users who have had activity for the length of time that the column header designates. To return to our previous example of analyzing use of a tool over the past year, the first row represents users who have used the tool for 12 months; the second represents users who have used the tool for 11 months; the third row represents users who have used the tool for 10 months; and so on. So for the third row, which represents users who have ten months of activity, there won’t be a cell representing users with 11 or 12 months of activity, because not enough time has passed for those users for anyone to be counted in that cell.
For more information about retention analysis, see our Retention analysis overview guide.