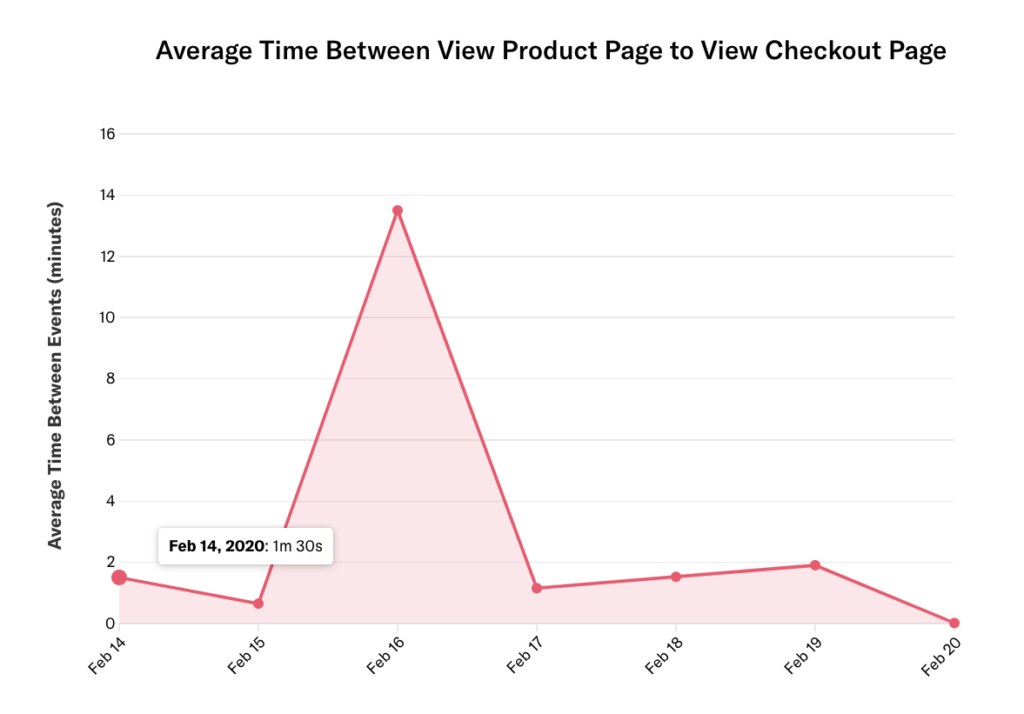
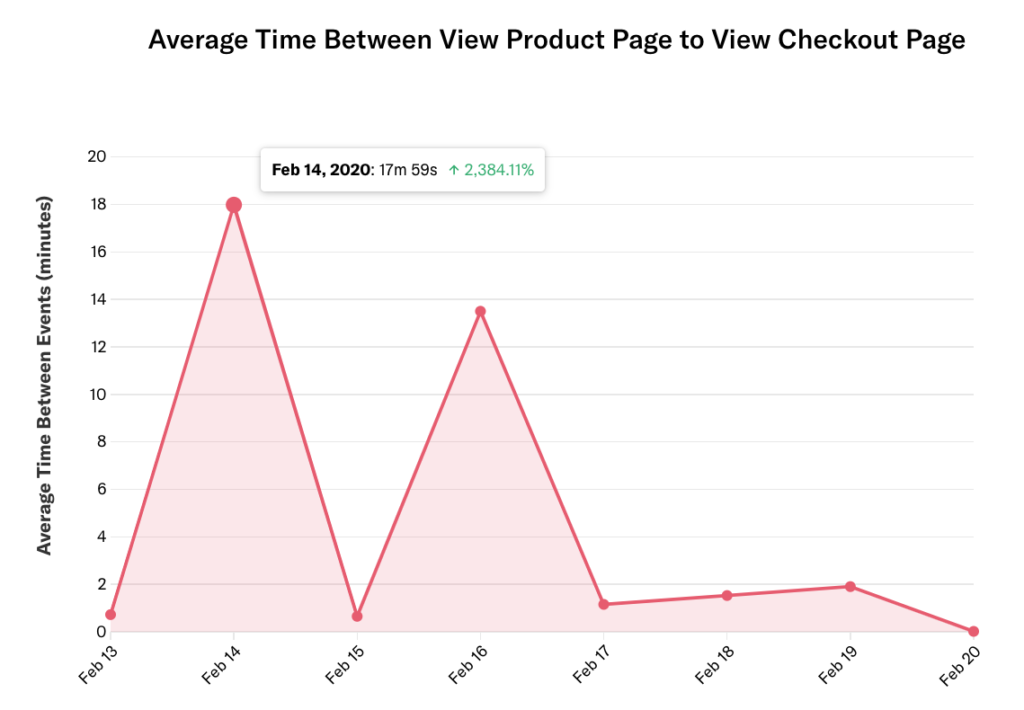
When charting average time between and conversion rate, you may notice the values change when you update the date range, even if you did not update the granularity.
In this example, when we chart the past seven days grouped by day, we see the average time between for Feb. 14, 2020 listed as 1 minute, 30 seconds.

If we update the date range to the past eight days without updating the granularity, we see the average time between for that same date jump to almost 18 minutes.

This is because the granularity is bounded by the time range, so both events must happen within the date range.
When the granularity is set to a day, we evaluate the average time between these two events over a 24 hour period. This means we will only include the average time between for any two events that happened within the past 24 hours. Conversions where the first event occurred farther past 24 hours will only be counted when you extend the date range to be large enough to include those events, e.g. updating the granularity to see conversions 2 or more days prior.
For example, if we consider a date range that includes both today and yesterday, and event A happened yesterday at 10pm while event B happened today at 8am, then the time between these events (10 hours) would be included in the average time calculation, because those events both occurred in the past 24 hours. Setting the date range to Today will exclude it from the analysis.