Overview
The Explore raw events page provides a birds-eye view of what users most often do on your site or app. You can filter by specific pages or screens, see the most common user actions on those pages, label any action as an event, or jump into analysis directly from this page. It’s the easiest way to get started with detailed analyses before you’ve set up any labels.
Users with Read-Only permissions will not be able to label events or conduct analysis from this page.
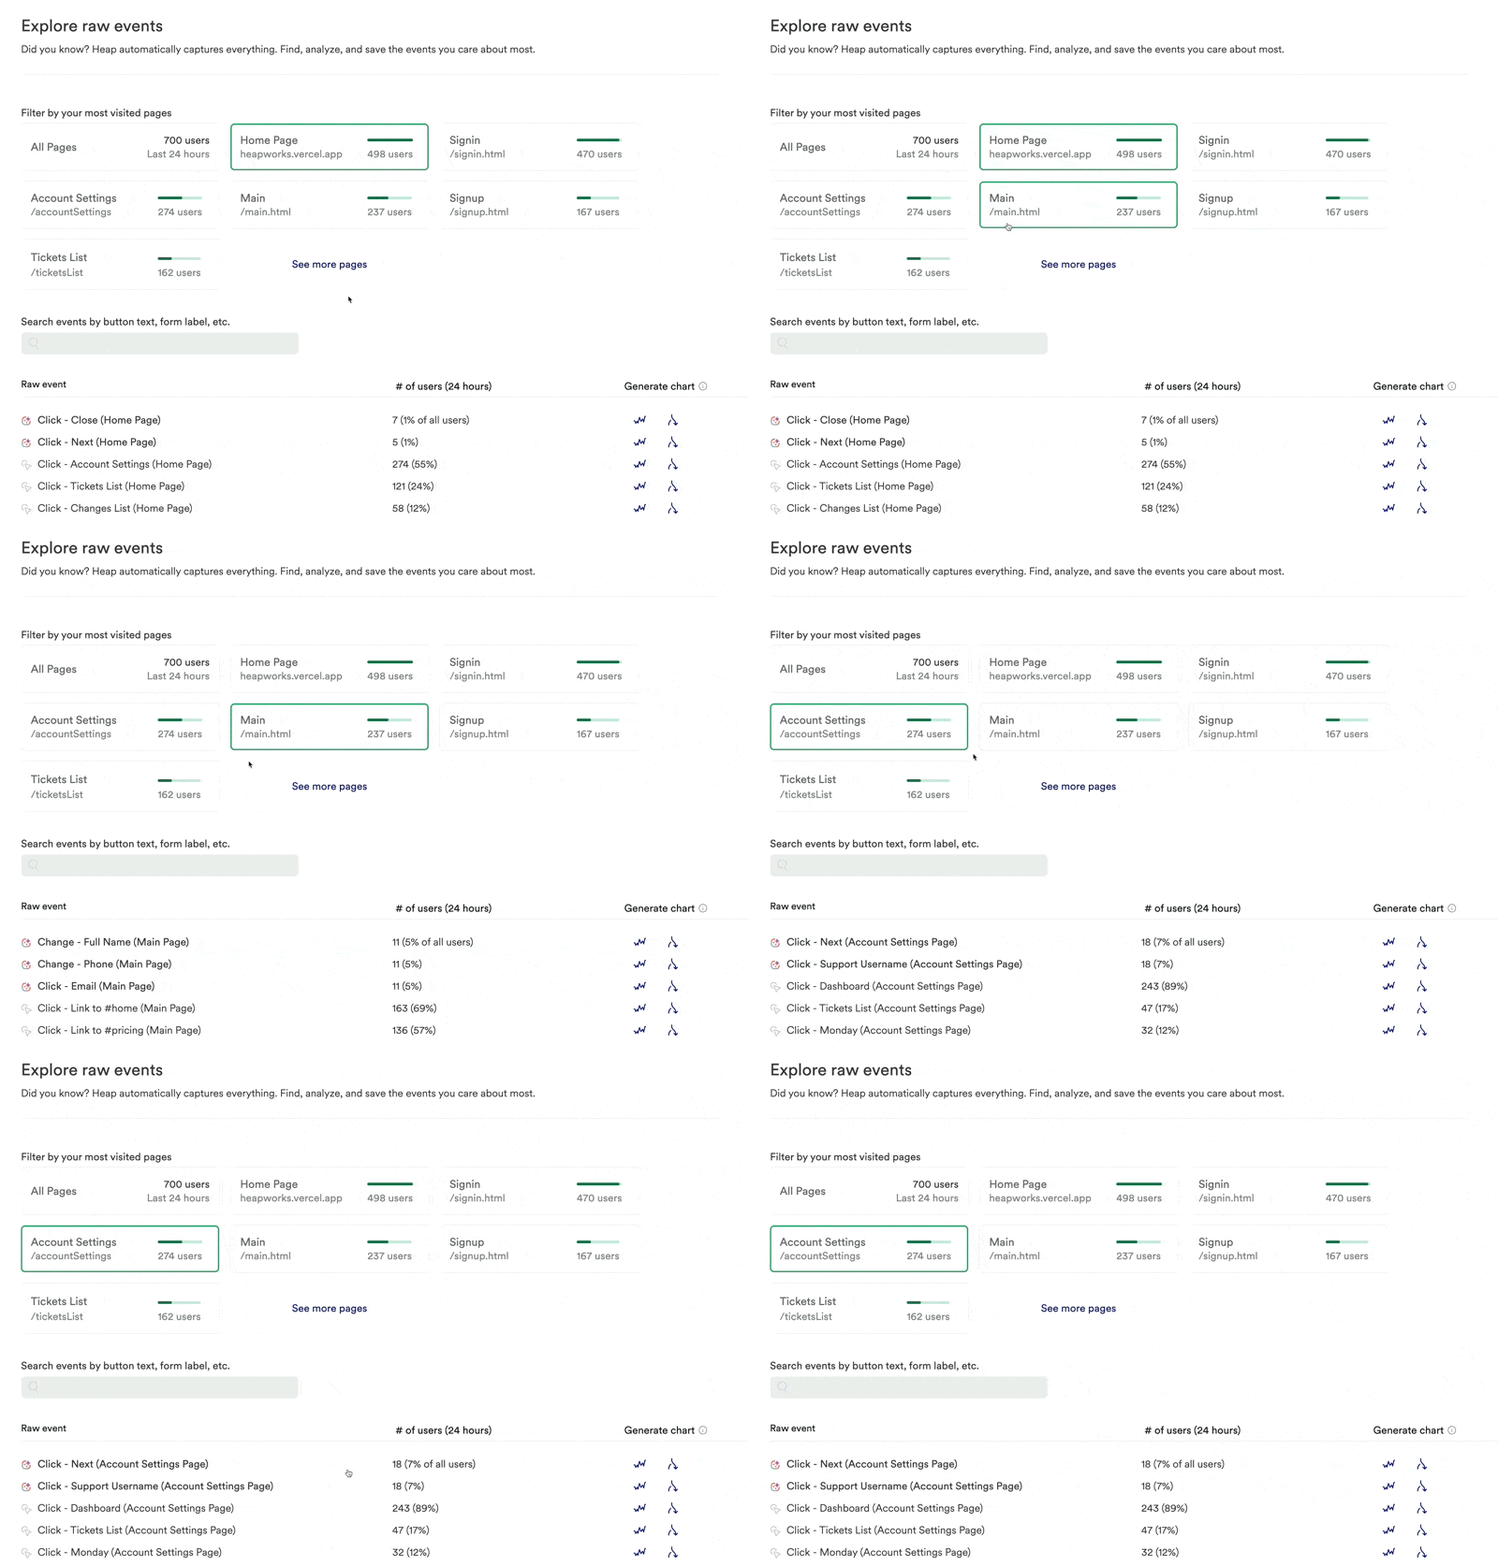
The cards at the top of the page represent the most visited pages in the past 24 hours or the past 7 days depending on your environment size. The Raw events at the bottom of the page are the most common events across all of those pages.
Clicking on a card will automatically filter the list of events down for only events that happened on that specific page.

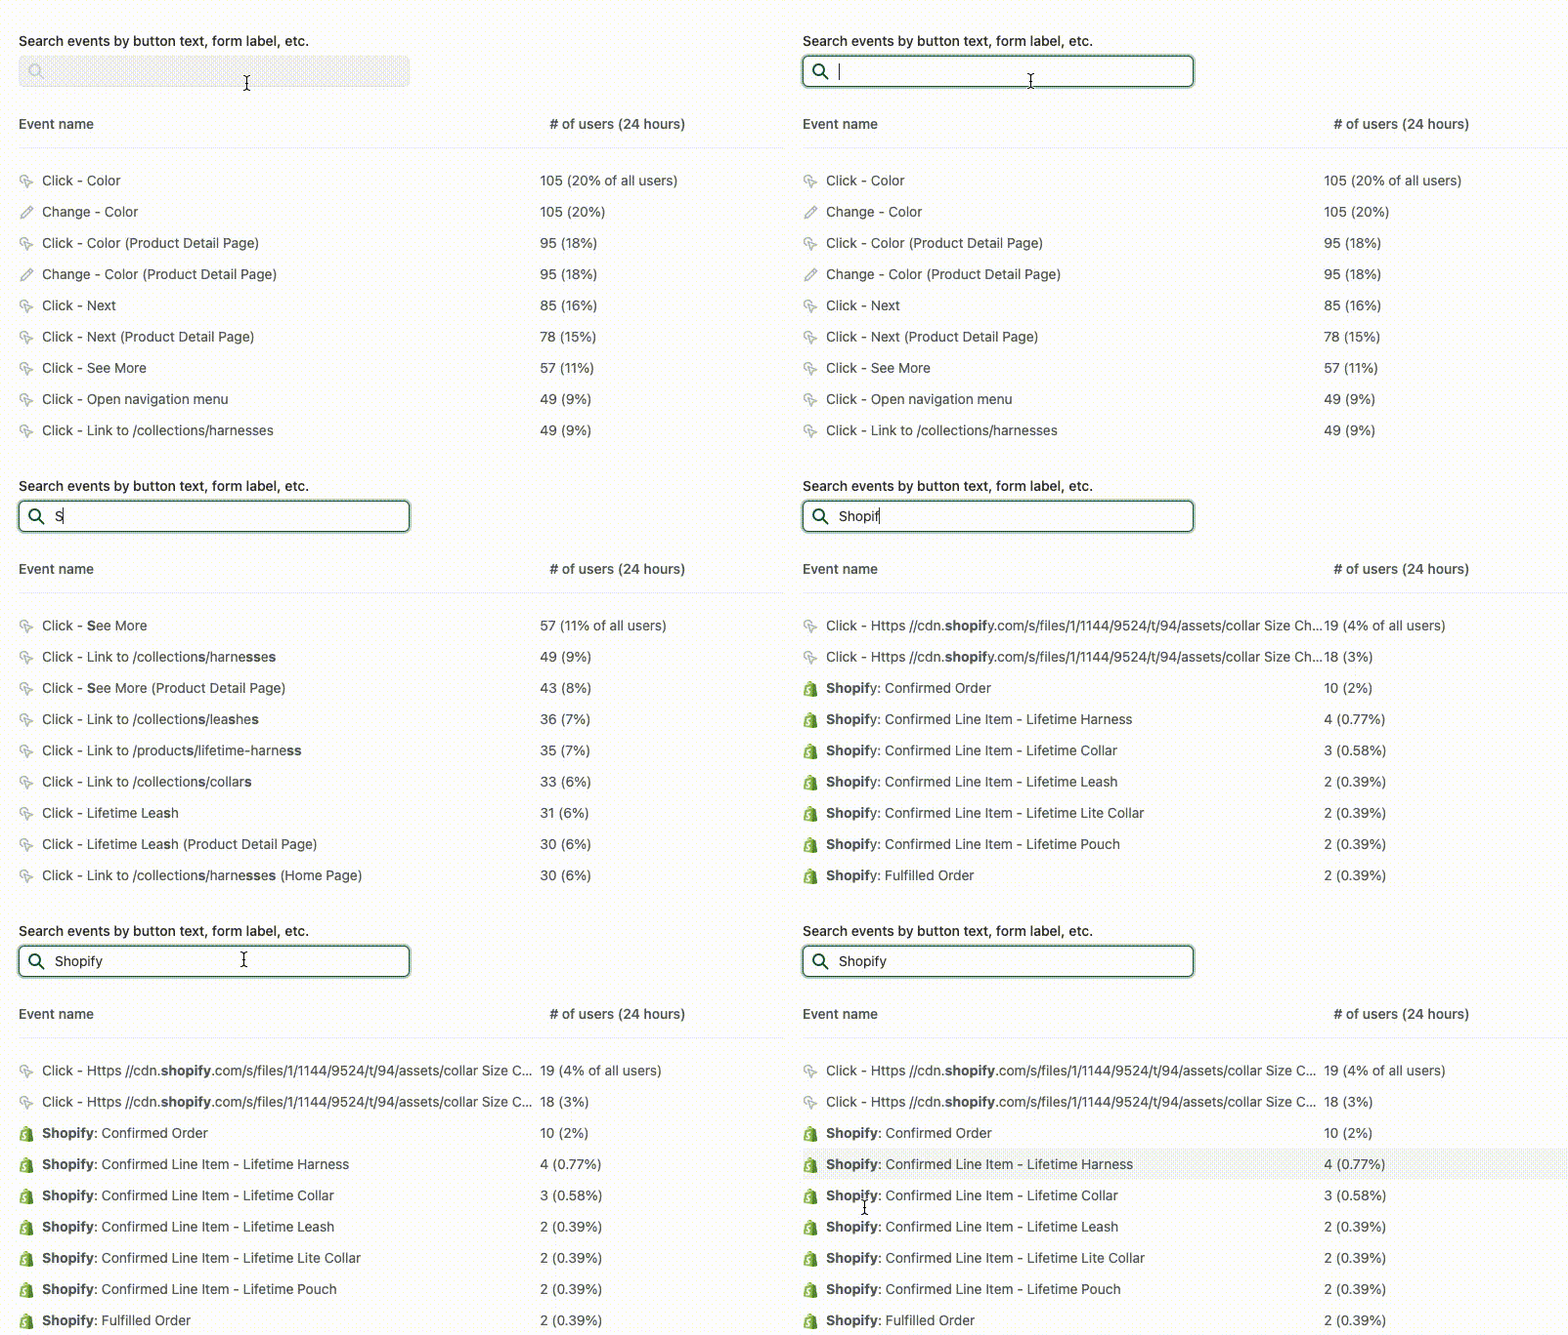
You can use the search bar to search for specific events, including events from integrations you may have set up.

Click on any event in the event list to jump to a usage over time, funnel, or path of the event, or to see the event details. If the event hasn’t been labeled yet, you’ll see the option to label it as a new event.
Supported Event Sources
Events sent via the following sources are supported in the Explore raw events page:
- Our standard web, iOS, Android, and React Native installations
- Client-side integrations: Appcues, Chameleon, and Intercom
- Server-side integrations: Shopify and Stripe
- Our server-side Track API (though these events will only show up on “all pages”)
Events sent via the following sources are not supported in the Explore raw events page:
- All other server-side integrations, including Hubspot, Marketo, Autopilot, Mailchimp, Sendgrid, Iterable, Salesforce Marketing Cloud, and more
- Our client-side `heap.track()` API
- Any integrations that only send user properties, such as SFDC
- All client-side integrations that don’t send their own events, including A/B testing integrations like Optimizely and Google Optimize
Frequently Asked Questions
What happens when I select an analysis option from the events list?
Selecting Usage over time will set up a count of the event from the past 7 days. If the event is not yet labeled, it will automatically be labeled as a personal event.
Selecting Funnel will set up a 2-step funnel with the event you clicked on as the second step, and the card you had selected when you clicked the event as the first event.
In some situations, it will source an equivalent existing event. In others, it might create two new personal events, such as if the card doesn’t have an equivalent pageview labeled as an event. If you clicked funnel with the All Pages card selected, then the first event will be Pageview.
Selecting Paths will set up a single Paths report with events leading into the selected event. You can always switch the event, or the drop-down to see paths out of the event, at the top of the page.
Why isn’t a certain page or screen in my app listed?
The most visited pages section is only set up to show the top 15 pages. If a page or screen is not listed, it’s because it did not rank in the top 15 most-visited pages in the past 24 hours or the past 7 days depending on your environment size.
The time window shown in this section, ex. past 24 hours or past 7 days, depends on your environment size. If your environment receives less than 100k events per week, then this section will show the top 15 pages for the past 7 days. If your environment receives more than 100k events per week, then this section will show the top 15 pages for the past 24 hours.
Why are multiple cards titled ‘Home Page’?
If your site has multiple subdomains, such as community.heap.io, help.heap.io, etc. these will be treated as separate homepages, which will result in multiple home page cards. The actual domain of the page is listed on the card.
Why do the metrics on this page not correspond to what I’m seeing in analysis?
The metrics provided on this page are meant to give you a general sense of recent performance. These metrics can fluctuate during that time window for a variety of reasons and may look a little bit different at a later date, though they should be relatively consistent. For precise measurements, use one of our analysis modules.
Why are there sometimes multiple versions of the same event?
Multiple versions of the same event may occasionally appear. This is to show you the difference between instances of this event across your whole site versus instances on specific pages. Note that the further you drill down on specific pages, the more often you’ll see this.
Where are the event names coming from?
For all events (labeled or unlabeled) the Explore raw events page will create a name based on certain properties of the event, such as the target text property of a click event. For example, if the target text for the “free trial” button is “free trial” then it will be named that in the Explore raw events page events explorer.
If it’s a labeled event, you can click the Labeled option at the end of the row to see the event details.
If it’s a raw event, you can click the Label button to do just that.
Why is my event showing as stale when it’s not?
If someone updates the event label criteria, or there is an update to your site that causes the event label criteria to no longer match the way it is labeled in the Explore raw events page, it may show up as stale. To fix this, you must rollback the change that caused this. If you don’t see any recent changes, we recommend archiving the labeled event and labeling a new one.