Overview
You can use Journeys to visualize and measure all of the different paths that users take through your product.
This can help you answer questions like:
- What is the impact of an event on a workflow?
- Do users convert at a higher or lower rate if they do [x]?
- Where did users come from before doing [x]?
- Where are most users going, and where are conversion rates the lowest?
How Journeys work
Keep in mind that within a journey chart:
- Journeys show the most common interactions in order, but not every sequential step
- Users are only counted once
- For journeys into an event we count users in the path they did first. For journeys moving out of an event, we count users in the path they did last.
To set up a Heap Connect query equivalent to a Journeys chart, see Path Analysis.
Building a journey
To build a journey chart, navigate to Analyze and select Journey (it may be behind the More overflow icon).
User or account journey
Account-based Analysis (ABA)
Account-based analysis is currently in beta. It will only be available to customers on Pro and Premier plans. To upgrade, contact your Customer Success Manager or sales@heap.io.
The first choice you’ll make is between creating a User or Account journey.
A User journey will compare the different paths that individual users take through the steps you specify. An Account journey also compares paths, but it looks at what accounts are doing instead of individual users.
Each step in the Account journey could be completed by a different user, but still counts as a conversion if all the users are in the same account. Account journey may be especially interesting to you if you are a B2B SaaS company.
To change what defines an “account” for account-based analysis, go to Account > Manage > Account health analysis. Choose the appropriate property from the drop-down and click Save changes.
Started or Completed
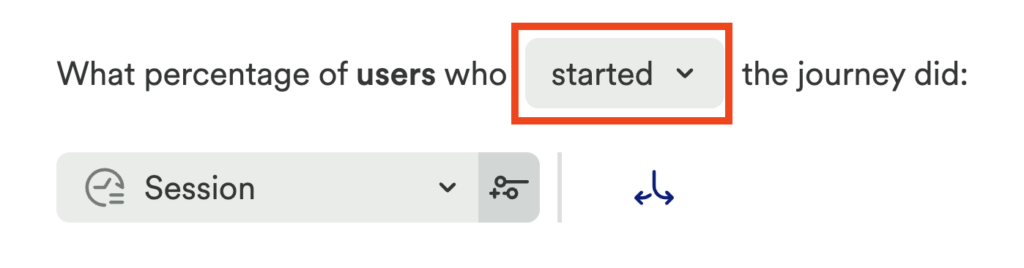
The next choice you’ll make is the event that you’ll build this journey around, and whether you want to see a journey leading into the event or out of the event.
Select started if you want to see a journey coming out of your chosen event. For a journey leading into an event, select completed.
Examples:
- If you want to know how users are led into your checkout page, select completed and the event associated with visiting your checkout page.
- If you want to know where users go after signing into your app, select started and the event associated with signing in. From here, you can select Show common paths or add your own steps and branches.
See the most common paths
Want to quickly see the most common paths that come after just one event? Select started, choose your event, and the Show common paths button will appear.
Steps and branches
Steps are the core building blocks of the journey. They’re events or actions that users take. Click Add step to add another step to your journey.

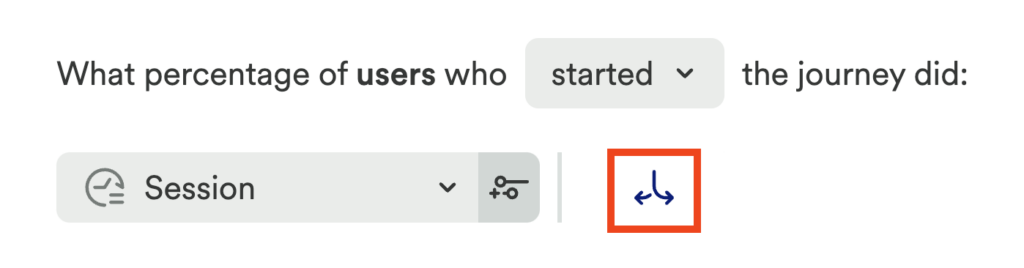
Branches let you visualize alternate paths. Click the Add a branch icon next to a step and it will allow you to build out alternate paths.
Include users who skipped this step
Select Include users who skipped this step to create an additional path in your journey analysis results.
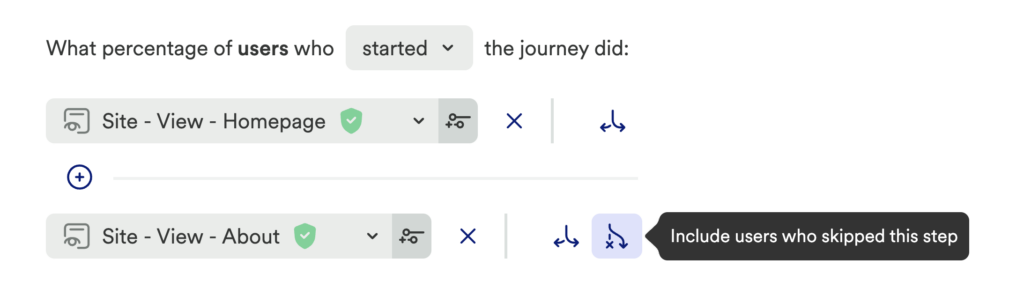
Applied on a single step, this will add a new path to the journey analysis results which shows users who didn’t do that step, but still continued on the journey. For more details, see the example Understanding “users who skipped this step” paths below.
When applied to a step with multiple paths, this option will add a new path to the journey analysis results which shows users who did none of the other events.
See your results
Once you’ve built out your steps and branches, click View results and the journey chart will appear.
Explore other paths
Curious about what your users are doing other than the paths you’ve set up? Once you have a journey chart, click + Explore other paths to see common autocaptured events that users do after a step.
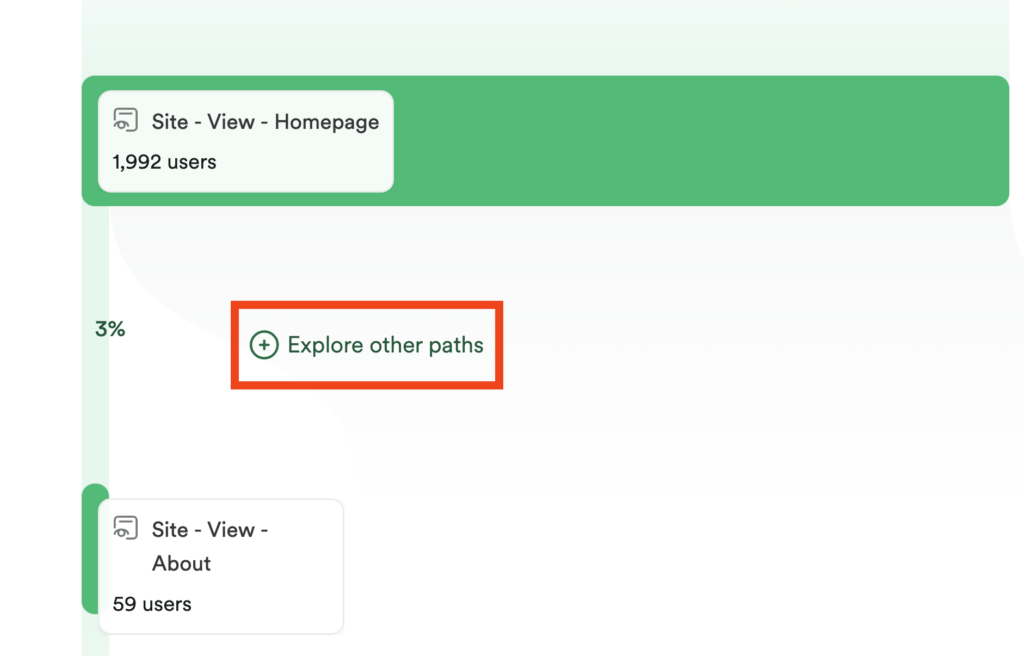
A flyout will open on the right side of the screen, showing you the most common events users took after taking a particular step in your journey. This can help you better understand what your users are doing and if there are alternate paths you should add.
The list of events you see after clicking + Explore other paths reflects where you clicked within the journey chart. In the example above, clicking + Explore other paths will show us the most common alternate paths users took between the two events (viewing the Homepage and viewing the About page).
Click Add branch to journey to include it in your journey.
Extending a path
To see what users do after a final step in the journey, click on the + Add at the end of a path to see what common events users do after the final step of the journey.
If you hover around your journey, you will notice the + Add button appears. You will see it before a given step, after a step, or as an alternative path to the step that you’ve already added.
Clicking + Add will open a flyout that lists the most common interactions that users have in that part of your journey.
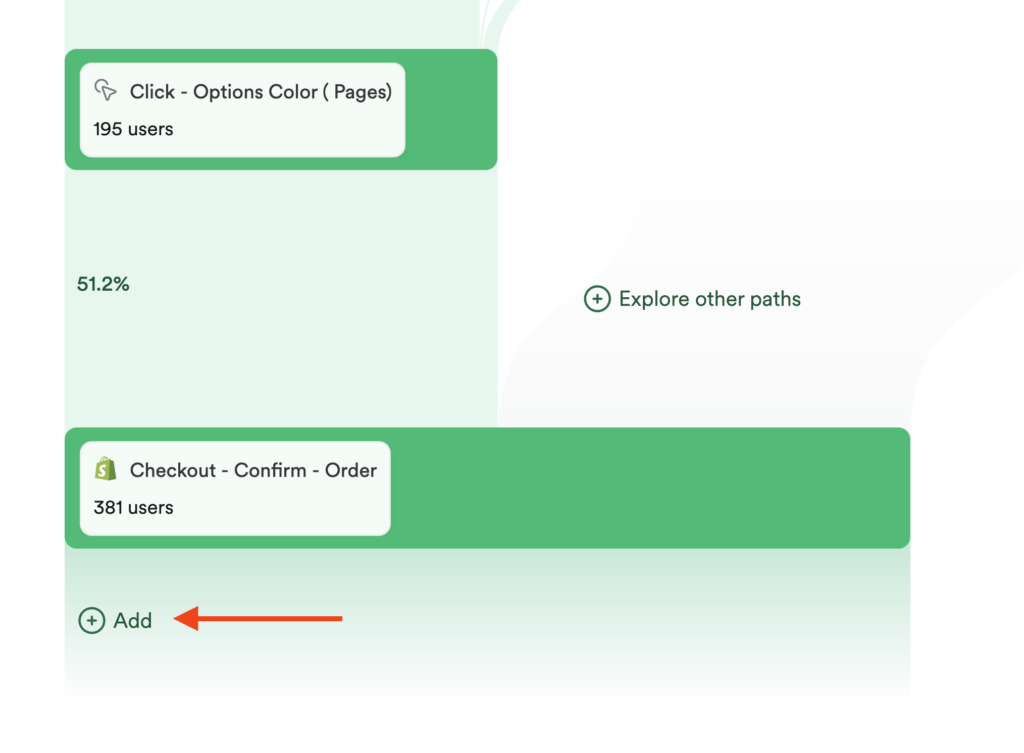
The list of events you see after clicking + Add differs depending on where you clicked in the journey chart. In the example above, clicking + Add will show us the top events that users did after the last step in the journey (checkout).
If you see a step that interests you in the flyout, click + Add step to journey.
What events are included the flyout?
The following unlabeled events are included in the top events flyout by default:
- Pageviews
- Interactions
- Integrations (third party events)
- Server-side custom events
You can toggle these on and off by clicking Filter in the top right corner of the flyout.
If you want to include client-side custom events, please contact us via the Get Support page so we can enable this for you. To learn more about events in Heap, see types of events.
Conversion rates
The numbers between steps show the conversion rate from the prior step to the next step.
Completion rates
Completion rates, shown at the end of the journey, show the overall completion rate from the first branch of that path to the final step.
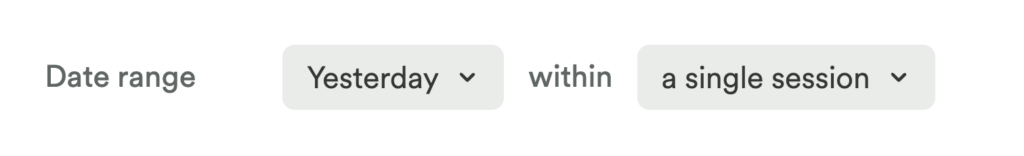
Single-session journeys
Session-limited journeys track user progress within a single session. Each user is still counted only once, even if they performed a journey multiple times in that date range.
What is a session?
A session in Heap is a period of activity from a single user in your app or website. It can include many pageviews or events. On web, a session ends after 30 minutes of pageview inactivity from the user. On mobile, a session ends after 5 minutes of inactivity, regardless of whether the app’s background or foreground state.
Heap will display one session and visualize the journey from within that session. In single-session journeys, the chart will display whichever session made it the farthest along in the journey. If a user made it equally far in their journey multiple times, then the journey will display whatever path happened first.
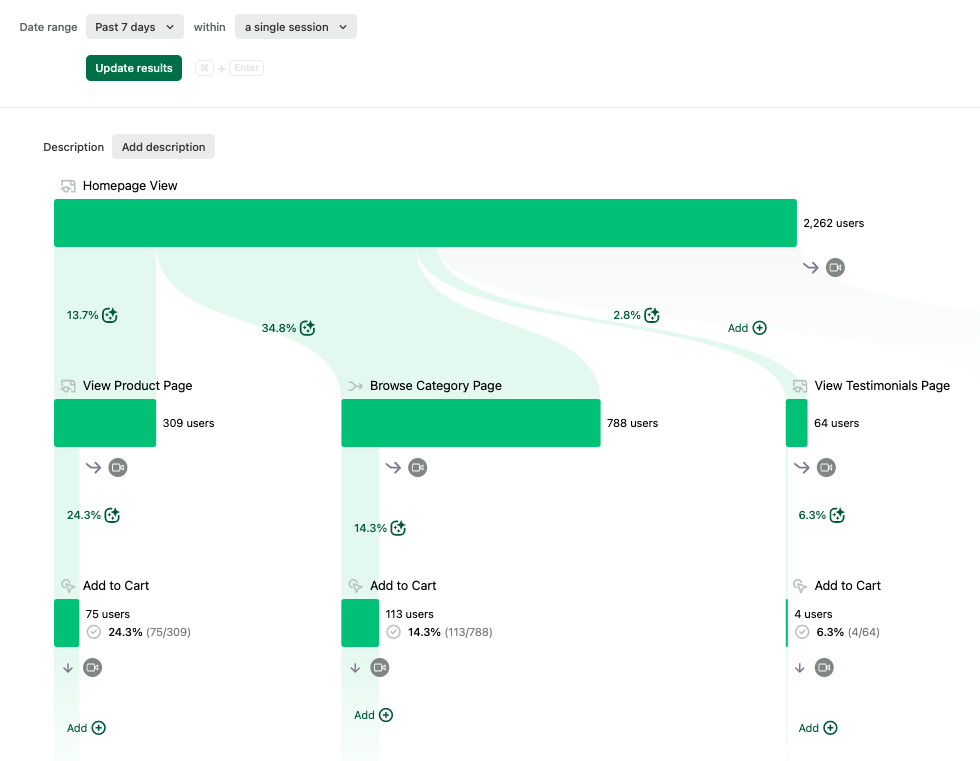
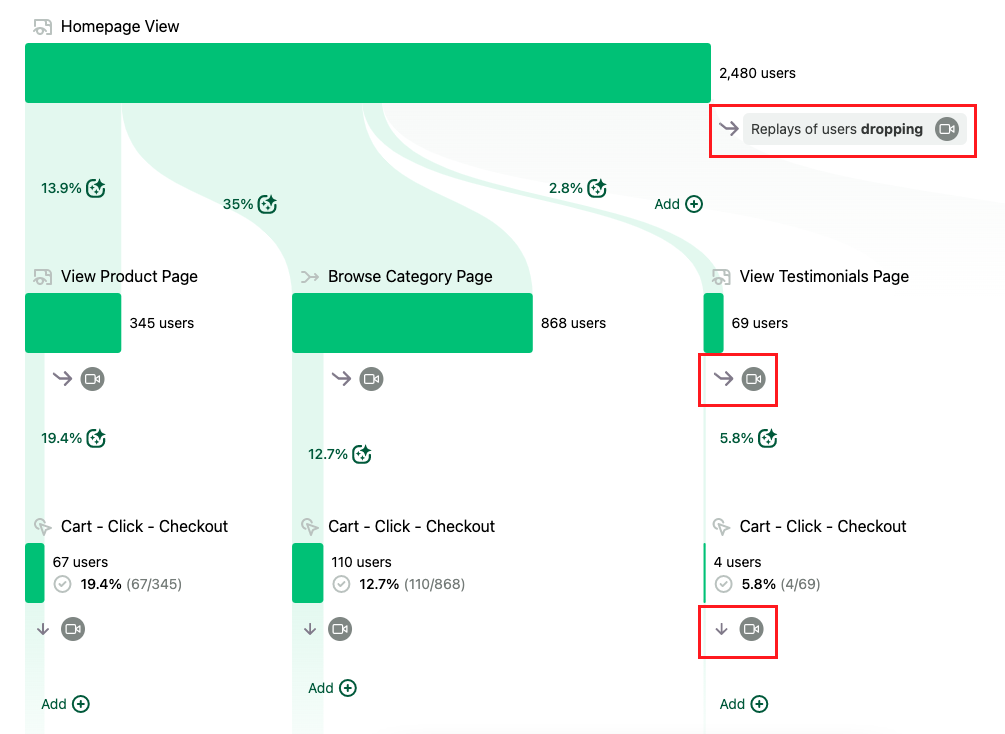
For example, in the single-session journey above:
- On Monday, User A did Homepage View > View Product Page. On Tuesday, User A did Homepage View > Browse Category Page > Add to Cart. Because the Tuesday session progressed the farthest vertically, Heap will display the Tuesday journey.
- On Wednesday, User B did Homepage View > View Product Page. On Thursday, User B did Homepage View > View Testimonials Page. In neither session did they do Add to Cart. Because both sessions got equally far, Heap will display the Wednesday journey because it happened first.
Watching session replays of journeys
Session replay is an add-on feature for paying customers only. You may try the feature for free for 14 days or 10,000 sessions (whichever comes first), after which you must contact Sales to continue use.
If you have session replay enabled, you have the option of watching replays of users dropping off after each step of your journey, and of users completing the end of your journey.
Use cases & examples
Visualizing alternate paths
You can visualize diverging, alternate paths by building a journey with multiple paths. This can be useful if you’re trying to understand how and why users choose and then navigate through different workflows.
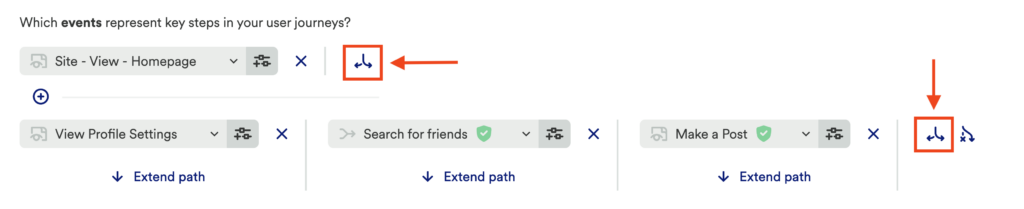
Say you have 3 different activation paths that users tend to take while onboarding to your app: viewing their profile settings, searching for friends, or making their first post. You want to understand how many users start down each activation path, and how many users end up successfully activating.
You might start by setting up your journey with an initial event like a Homepage View, then click the Add a branch icon to add more paths to the second step. You can also start with a forking branch in the first step of your journey.
If a certain path has steps that apply to only that path, you can click Extend path to continue mapping out that user path. As an example, let’s say that the steps View Profile Settings and Search for Friends each have their own secondary steps that don’t apply to Make a Post. You could click Extend path to add additional steps for each of the first two paths.
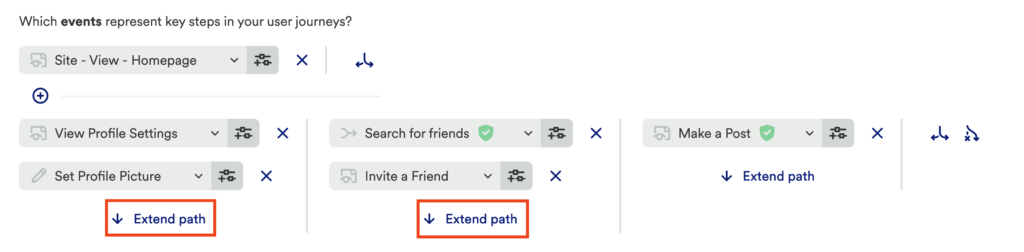
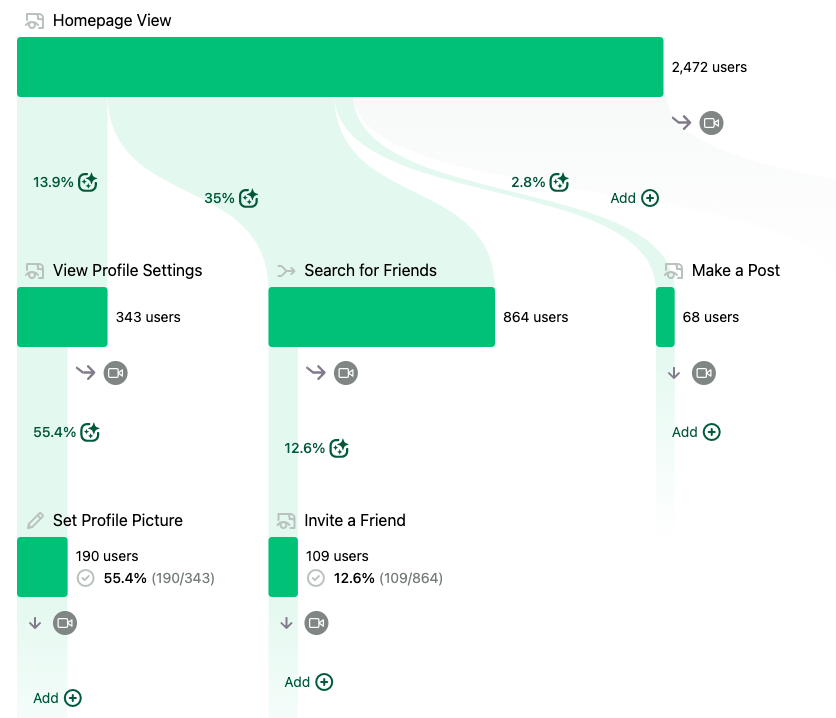
From here, click View results to see how and where your users end up activating.
Visualizing happy and unhappy paths
If all paths eventually end up at the same event, you can add additional steps to the end of the user journey to compare completion rates. This can help you decide what paths to push your users towards or where to focus your product improvement efforts.
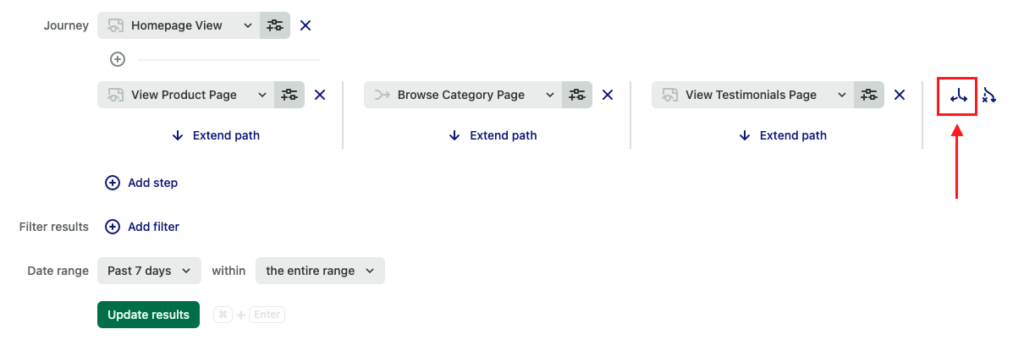
For example, let’s say you have an eCommerce website and there are multiple different ways for your users to find and buy a product. You can start with a Homepage event and then click the Add a branch button to include several of the most popular ways users end up buying a product: View Product Page, Browse Category Page, or View Testimonials Page.
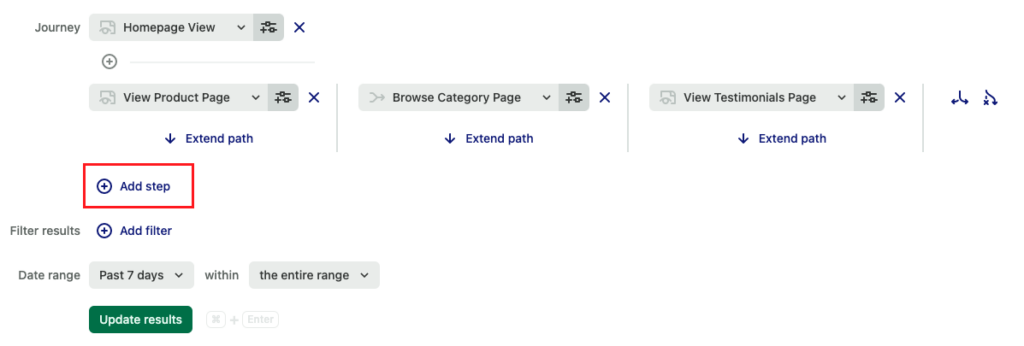
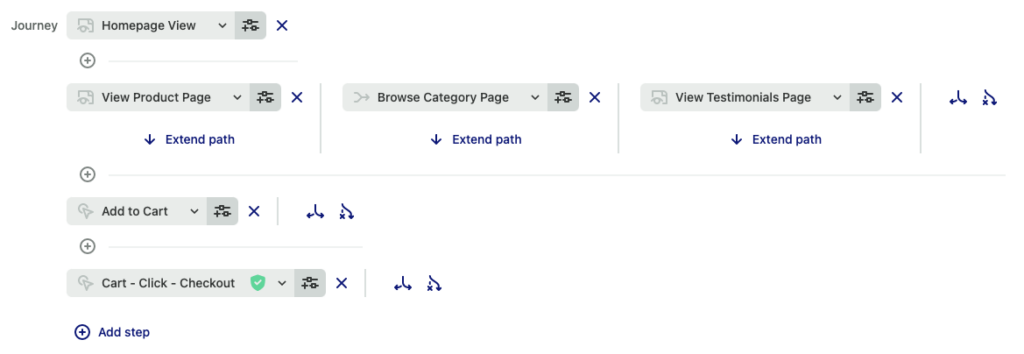
While these branches may vary, they all eventually end up at the same place: Add to Cart and Checkout. To show this, click Add step and then add these additional steps at the end of your journey.
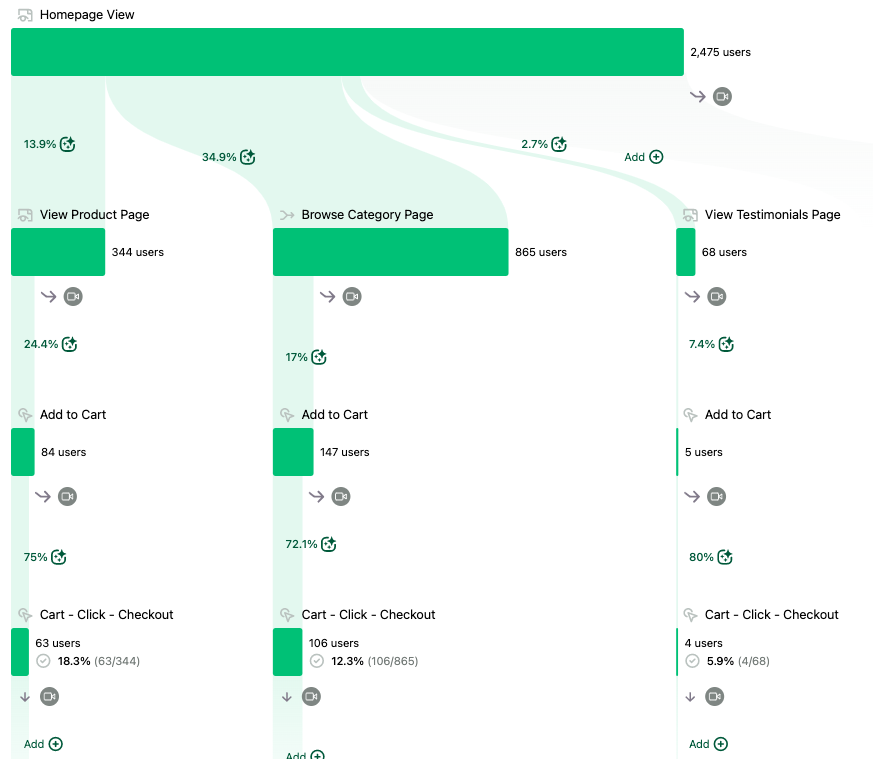
This will produce a journey result that looks like this:
Once you click the View results button, you can compare and contrast these different journeys against each other to understand what users do most often after viewing the Homepage, and which of those paths ends up converting the best.
Understanding “users who skipped this step” paths
What if you have a journey where users have multiple choices, or could choose not to do a step at all?
For example, let’s say you’re running an eCommerce website and you’re trying to understand the impact of different features on your product details page. You have a Virtual Try On feature and a View Reviews feature, but you’re not sure if they’re driving conversion rates, and if you should invest in adding more of these features. You can build a journey that shows if users engage with those features, and what impact they have on conversion.
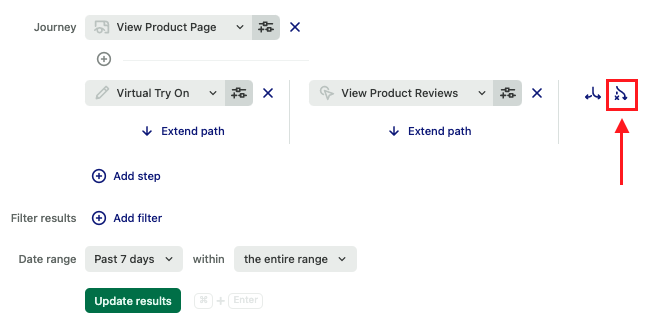
Start with View Product Page as a starter event, and then click Add a branch to create multiple paths for Virtual Try On and View Product Reviews. From there, select the Include users who skipped this step option.
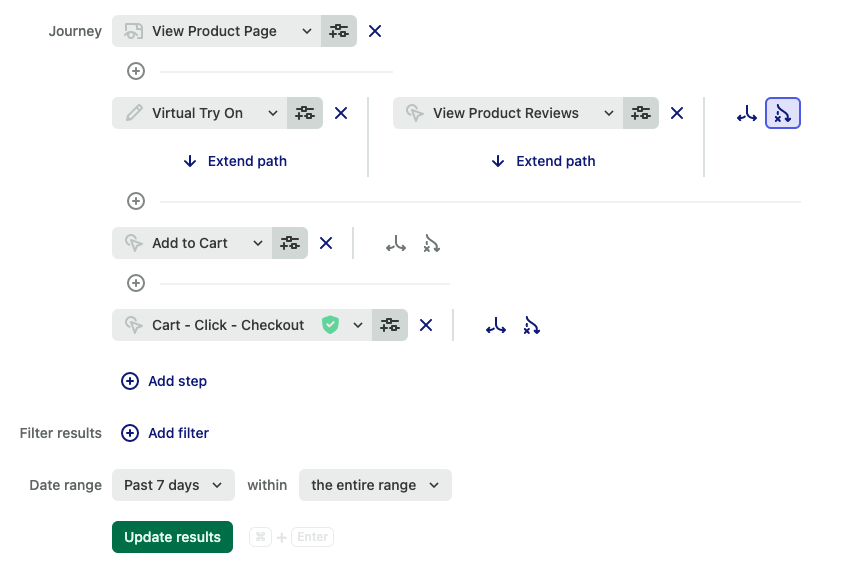
Next, build out the rest of the purchase journey by clicking Add step. This might include Add to Cart, and Checkout for example.
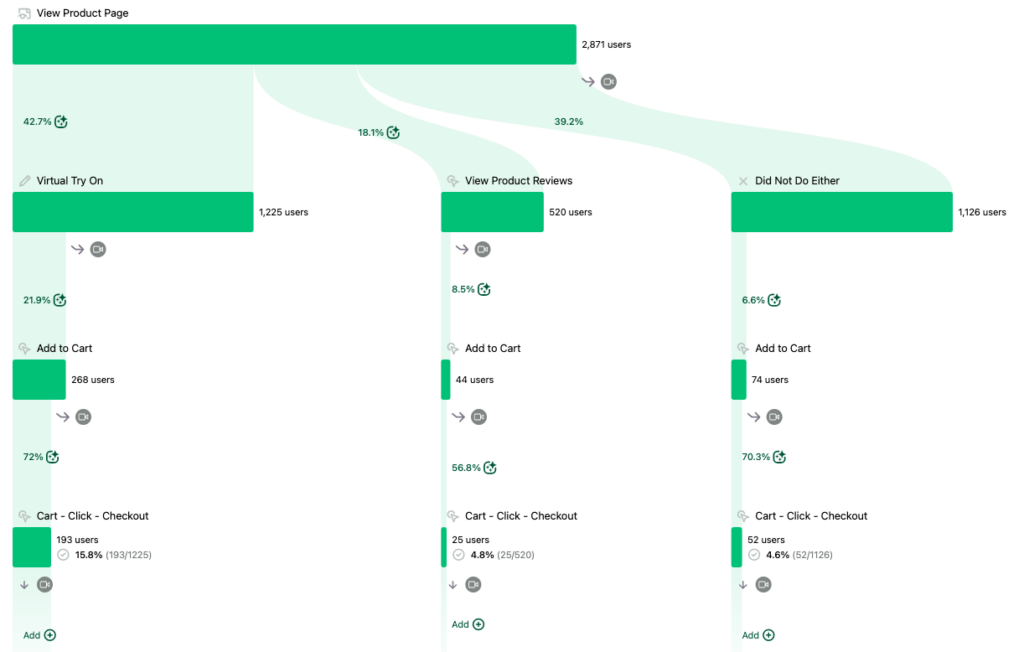
After you click View results, you can then see the journey divided up into three paths: Users who used Virtual Try On, users who did View Product Previews, and users who did neither of those branches. You could then compare completion and dropoff rates for each to decide what to do next with these features.
Frequently Asked Questions
What’s the difference between Journeys, Paths charts, and Path Comparisons in Funnels?
- Journeys is best for any type of complex or exploratory user discovery. You can visualize alternate paths, complex workflows, and measure completion rates all in one chart. Heap will even assist you as you build your journey, surfacing surprising or untracked alternate paths.
- Path Comparisons in funnels, on the other hand, are a great tool for quickly checking a simple hypothesis about a funnel. For example, you could check if users convert from View Product Page to Add to Cart more or less often if they click View Size Guide after they View Product Page. Journeys and Path Comparisons rely on the same data and logic, so they will produce the same results if you build out the exact same chart in both.
Why do I get a different set of suggestions when I click “Show common paths” versus clicking “+ Add” on the same edge?
Show common paths considers the first pageview or screenview event before or after the selected event. Clicking + Add returns all events users do after the selected event.