Paths analysis will be discontinued beginning in May 2023. We recently launched Journeys, a more insightful, visual map of the paths users take throughout a product. Learn more about this update in our community post. Note that this deprecation does not apply to the Path property.
Overview
The paths chart in Heap allows you to explore the customer journey by showing you the most common paths into and out of an event. You can use this information to:
- Understand where users go after landing on your website or signing in
- Identify bottleneck points where users are dropping off before converting
- Understand how the customer journey is affected by referral channel or device type
- Understand how the customer journey varies between different user segments
The following Suggested Charts use the paths chart. Click any of the links and populate the fields provided to quickly get up and running with your first path chart.
- How are repeat users of a feature discovering that feature?
- What are the most common paths that users take after landing?
- What are the most common paths that users take before purchasing?
- What are new users of a feature doing in my product?
Setting Up a Paths Chart
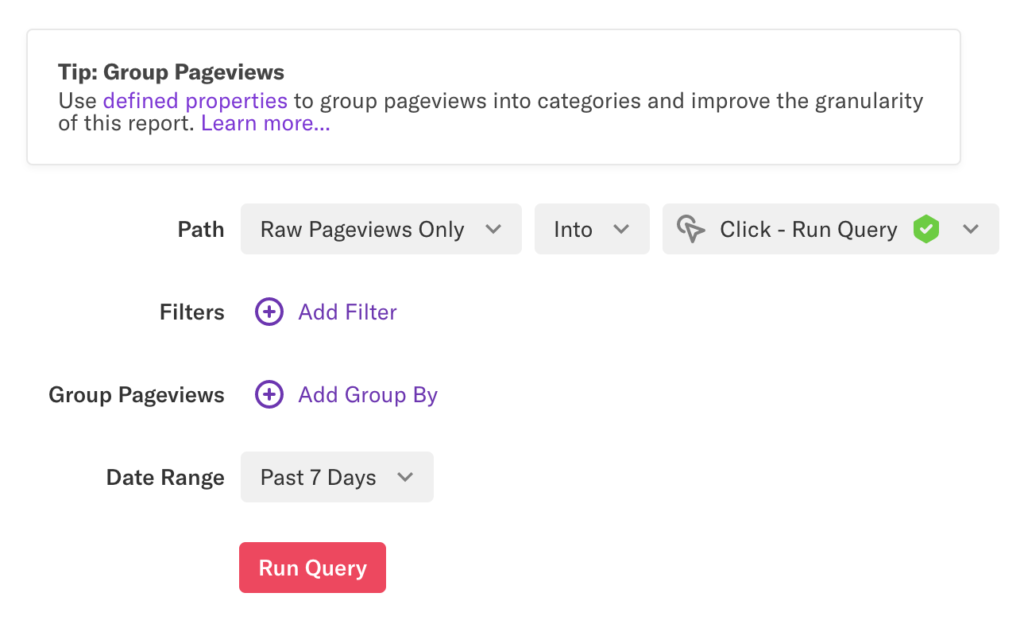
To set up a path, navigate to Analyze > Paths. On this page, select one of the following: see only raw pageviews, only defined events, or both raw pageviews and defined events.
On Android and iOS apps, autocaptured screen view events will appear in paths as pageviews. If you are including raw pageviews, we recommend using defined properties to group page types into categories. See the Grouping Related Paths section of this article for more info.
Into: To see where users are coming from before this event.
From: To see where users are going after this event.
Event: Select the event you want to see paths into or out of.
Filters: You can filter by the following:
- User properties or segment to only see certain groups of users
- Device type to understand how the customer journey varies between mobile and web
- UTM source (or other session property) to understand how a referral channel impacts the customer journey
Group Pageviews: Because of the nature of paths analysis, the group by tool in paths works differently then groups bys for other analysis modules.
Every app is structured in a unique way. To allow you to view the user journey through your app with the right level of granularity, you need to create defined properties to group by. For example, you may wish to group together similar URLs (such as for product features in the same category). To learn more, see the defined properties section of the Properties guide.
Date Range: Choose the date range over which you analyze your path. By default, Heap will set the date range of the chart to the previous 7 days. The paths view supports the following ranges:
- Today
- Past 7 Days
- Past 30 Days
- Past 90 Days
- Past Year
- Date To Now
- Choose a Date Range (a custom date range)
You can also choose to exclude certain events from your analysis to filter down to specific paths. See the Exclusions section of this article to learn more.
Understanding the Paths Chart
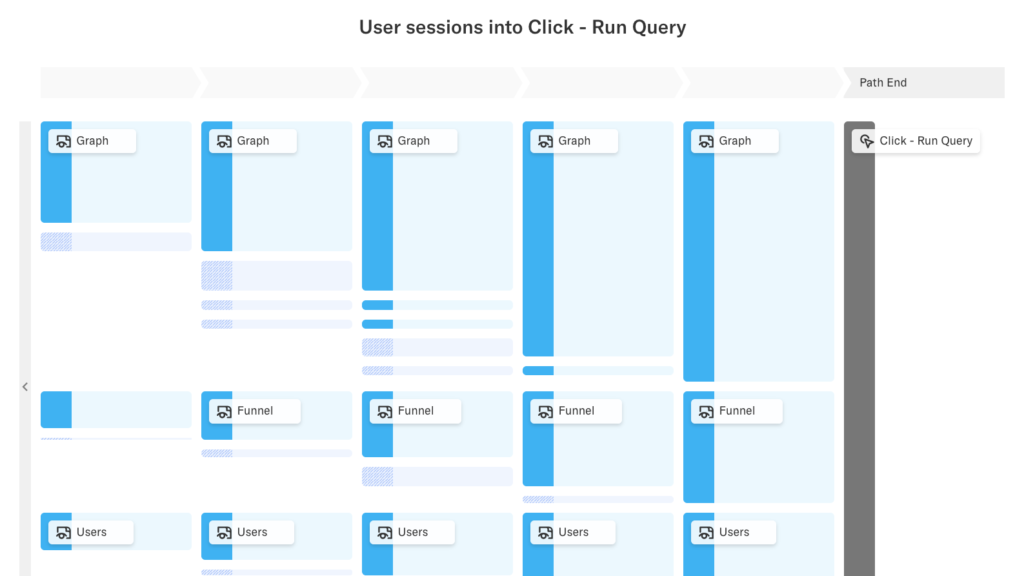
As an example, we want to see which types of pages users are coming from when they run queries in Heap.
In the resulting path, we see that the top three pages our users run queries from are users, usage over time, and funnel.
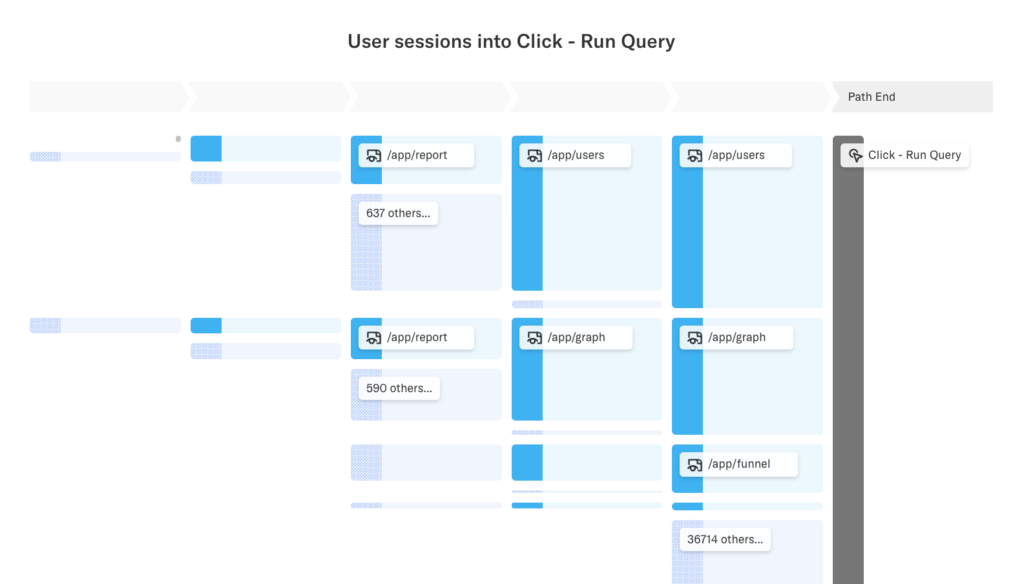
Hover over and click into the path steps to see more info. The path step headers will update to show you how far into the path the user took this step.
Paths will drill down to a maximum depth of 10 steps. The query will return the 1 million most common paths by the number of sessions.
By default, overly generic events, such as events with no filters and a selector that is empty or a wildcard character, are excluded from paths queries. This is to ensure the results of your queries are only populated with relevant results. You can easily remove this exclusion or add additional exclusions by following the steps below.
Exclusions
When hovering over defined events, you can click Exclude to remove the event from your Path analysis view. This is helpful for filtering out events that are too generic or are not relevant to your current analysis. Excluding an event will remove all paths that contained that event, so you should expect to see the percentage of sessions in the other events increase with each exclusion.
If we modify our previous example to include events, we would want to exclude our View Any App Page event as it’s too generic for the current Path analysis.
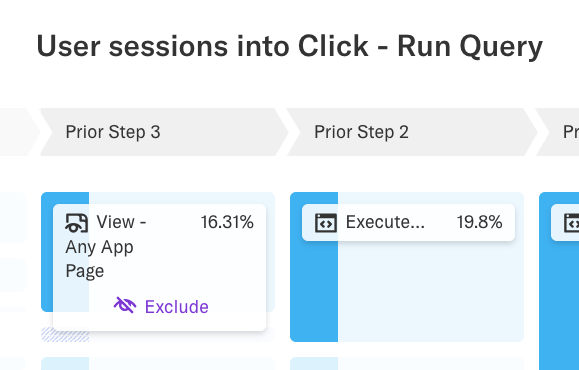
You’ll see the query update to show that x number of events have been excluded from this Path analysis. Click on the Excluded x events text to see which specific events have been excluded.

Grouping Related Paths
You may notice a lot of pageviews being automatically categorized as ‘other’. In Heap, we have lots of URLs with unique identifiers in them. For example, ‘/app/event/123’ and ‘/app/event/456’ both mean ‘viewing an event definition’, though they appear as distinct page views in this chart.
If your defined property has an ‘other’ category, Heap will automatically group all other paths into that category. To avoid this scenario, we recommend not setting an ‘other’ category. This will allow you to iteratively improve your property settings to provide the right level of granularity in your Paths.
As part of our example, to organize these pageviews so that we can see the customer journey with the right granularity, we’ll make a new defined property called Page Type, which will group these similar URLs together. Here is a section of what that property looks like, where each URL is nested under a conditional constant case.
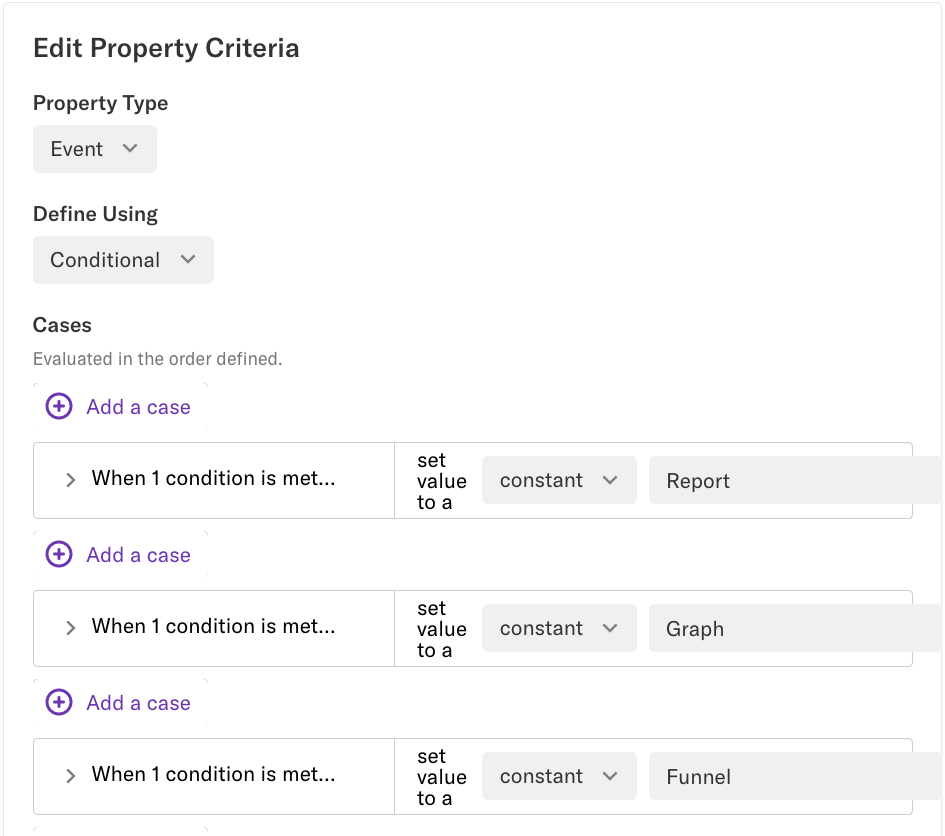
Now that we’ve created this property, we will use it to group our paths together in the Paths chart.
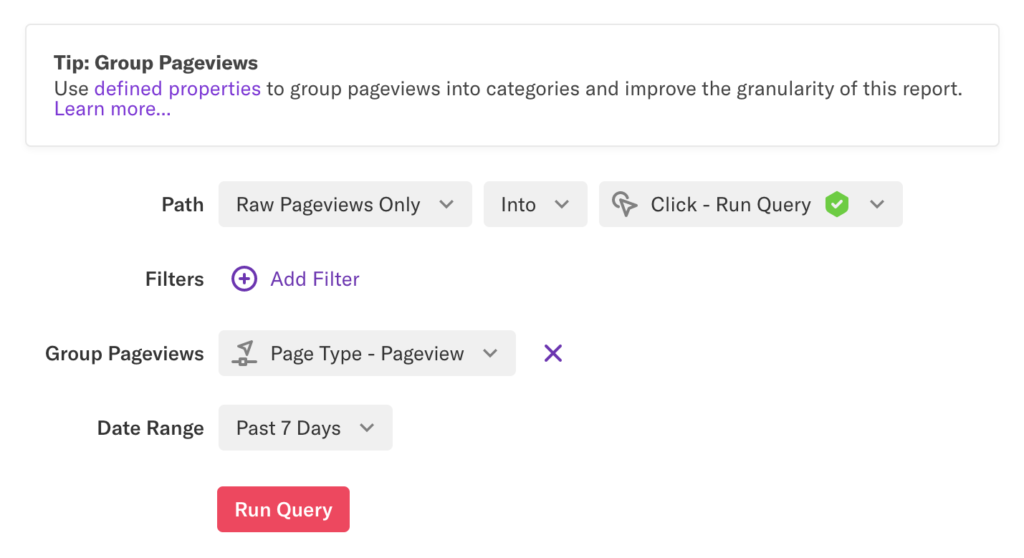
In the resulting path, you can more easily see which pages users came from before clicking Run Query, and that the ‘other’ category is much smaller, giving us a much clearer view of the user journey in our chart.
Run Query Hotkey
You can also press Command + Enter (Mac) or Control + Enter (Windows) to run queries.
Combo Events
Combo events are used to control the granularity of analysis. To ensure you won’t have to use exclusions to see your combo events in paths, we’ve prioritized the visibility of combo events over other event types.
When multiple event definitions match for a Path step, we display the most specific definition available. For example, if you have the following events defined:
Event A: An event more specific than B, ex. ‘View Red Pants Products’
Event B: An event more general than A, ex. ‘View Shirts Products’
Event C: A combo event which contains one of A or B, ex. ‘View Red Pants or Shirts Products’
If a user action matches either Event A or B and also matches Event C, Event C will always display in the path instead of A or B. If you exclude C (the combo event) from your path analysis, then you will see Events A and B in your path.
Frequently Asked Questions
For FAQs about this chart type, see our Chart FAQs.