Dashboards are the main hub of your Heap account. They’re used to organize relevant charts in the same space to review all of your metrics in one place. You can create as many dashboards as you need, and organize them into categories by team, feature, release, and more.
We recommend building out high-level dashboards that span multiple teams to get a summary of how the needles are moving, and building focused dashboards to understand the depth of analysis.
Building dashboards
There are two ways to build a new, blank dashboard of your own. The first way is to click the New dashboard button from the Dashboards page.
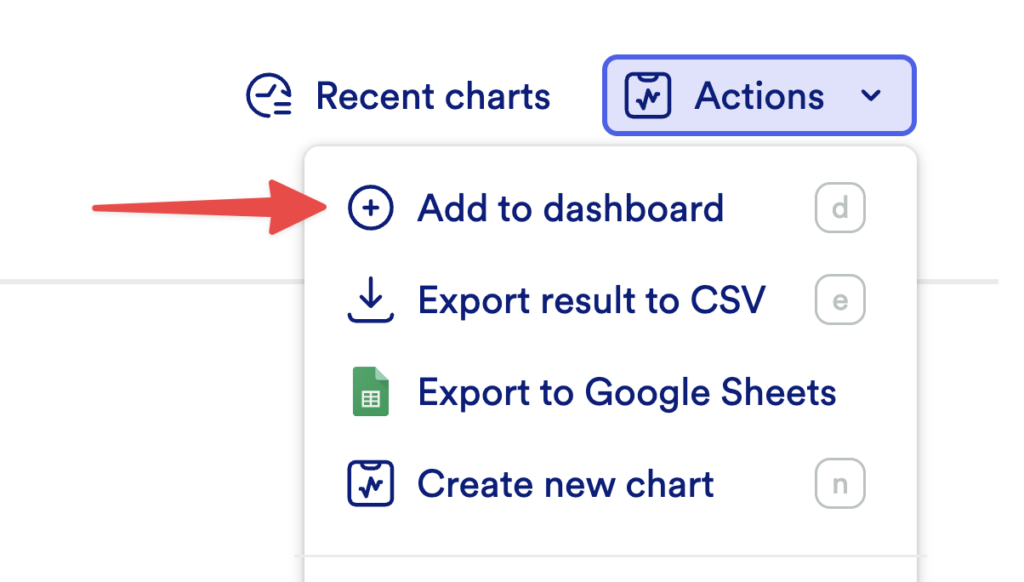
The second way to create a new dashboard is while viewing a chart. Click Actions and Add to dashboard, then a pop-up will prompt you to either select an existing dashboard or create a new one by clicking the + Add to new dashboard button.
When you create your new blank dashboard, you’ll see options to give your dashboard a name, add a description, and preview whichever charts you choose.
When you are satisfied with your new dashboard, click Save dashboard. You’ll then be given the option to select the level of visibility you want and to categorize it.
Starring dashboards
You can star dashboards you view often to make it easier to view them all in one place. Click the star icon next to the dashboard’s name to include it in your list of starred dashboards. Starred dashboards will always appear at the top of their category.
Deleting dashboards
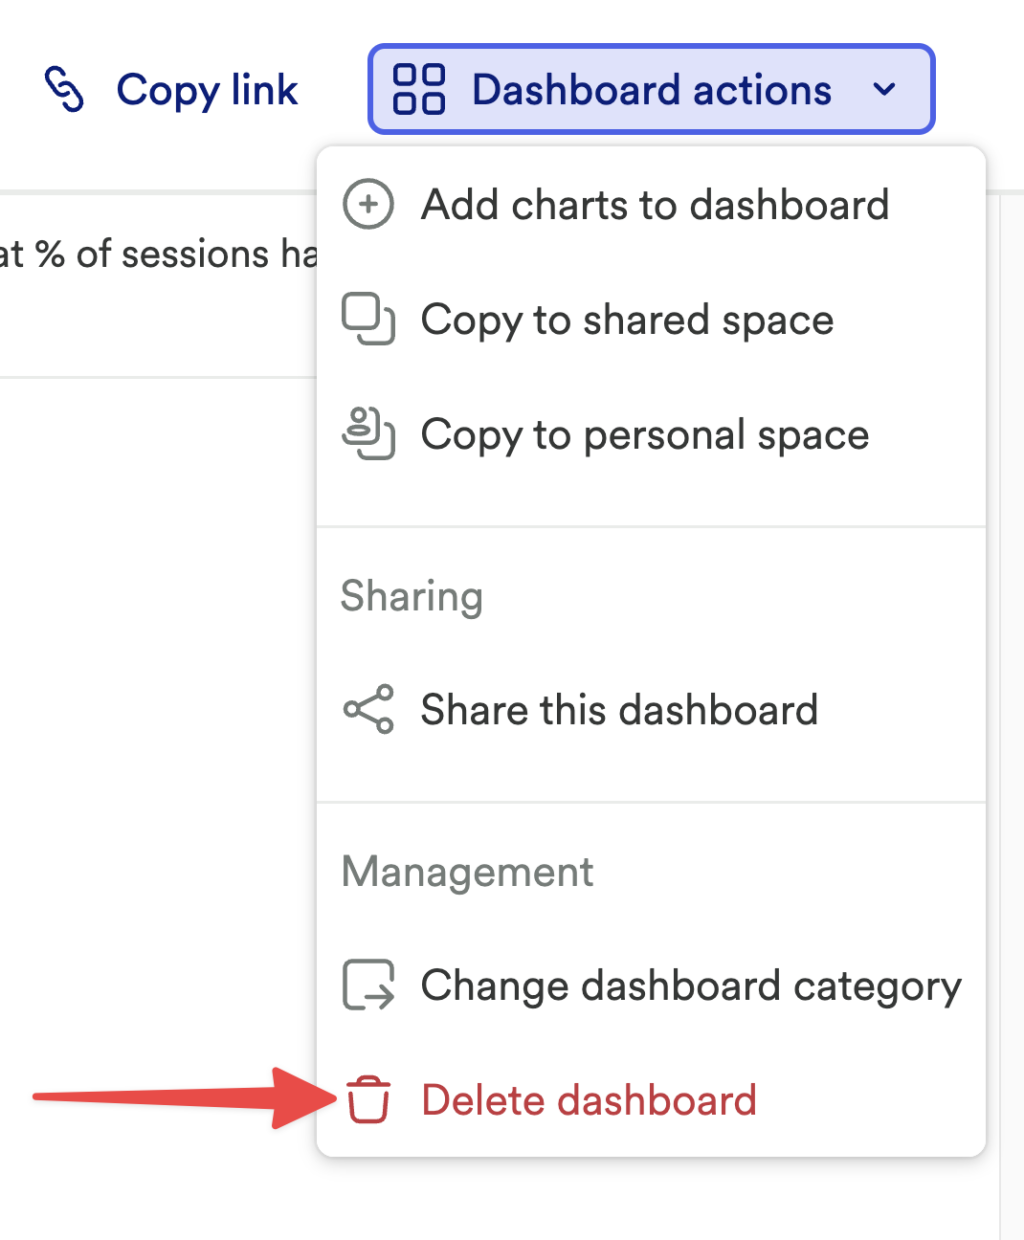
To delete a dashboard go to the Dashboard actions menu and select Delete dashboard. A pop-up will open to confirm that you want to delete the dashboard.
Adding charts to dashboards
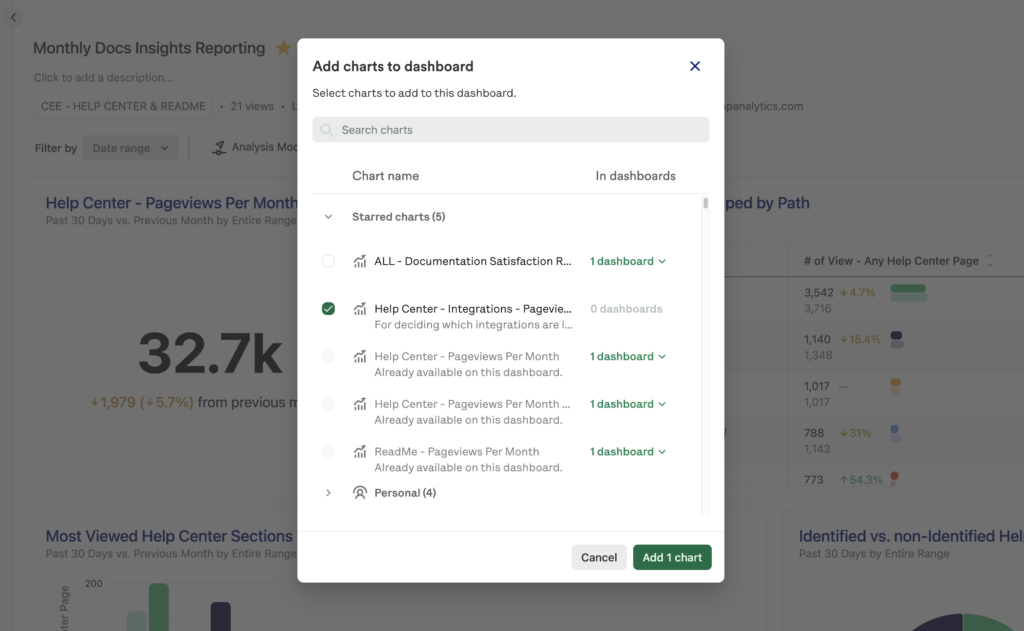
You can add charts to a dashboard either from the dashboard itself or from the charts page. To add charts from the dashboard itself, click Dashboard actions and then Add charts to dashboard.
A pop-up will appear where you can search for charts and select multiple charts to add to the dashboard. Click the Add charts button when you are done making your selection.
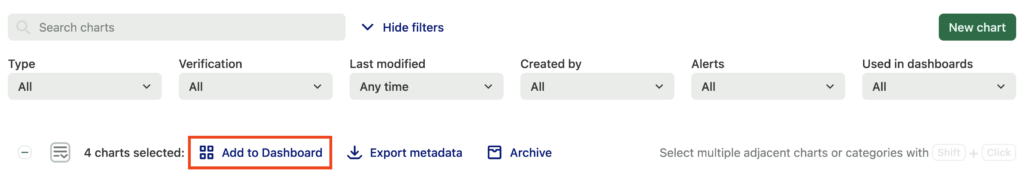
From the Charts page, you can add multiple charts to a dashboard by selecting the checkbox next to the charts and clicking the Add to Dashboard button.
Note: If a selected chart already belongs on a dashboard, it won’t be added to that dashboard again. Only selected charts that don’t already belong on the dashboard will be added.
Dashboards can hold a maximum of 100 charts. You can add usage over time, funnel, retention charts to dashboards.
Managing dashboards
Once you have several charts in a dashboard, you can drag the chart cards to rearrange them to your liking.
You can also resize dashboard cards to make certain charts more prominent than others. Click the ellipses (three vertical dots) icon in the chart card you wish to resize, then select the option for the size you want the chart to have.
Dashboard charts are cached for 24 hours from the time the dashboard was last visited. If you need up-to-date data, you can always click the Refresh button in the dashboard toolbar.
Within a dashboard, you can click the chart title to be taken to the corresponding chart.
You can organize your dashboards using the same categories you use across your account to keep things neat and tidy. Dashboards can also be created, copied, and moved between personal and shared spaces. While viewing a dashboard, click Dashboard actions to see the menu of options.
Sharing dashboards
To share a dashboard, click Dashboard actions > Share this dashboard.
Dashboards can only be shared with Heap users associated with your organization’s account. We recommend you invite teammates whom you want to share dashboards with. Externally sharing dashboards with non-Heap users is not supported.
Filtering dashboard results
You can filter dashboard results by account, event, or user-level properties to get additional insight into user engagement. You can use this to:
- Filter a feature adoption or usage dashboard by region, browser, device type, or most recent NPS score, which lets you see how one segment of users are doing at a glance.
- Filter a traffic or conversion dashboard by UTM or marketing channel, which enables marketers to quickly zoom in on how your marketing campaigns are performing.
- Filter a feature adoption dashboard by CSM or Account Manager as a way of using dashboards as scorecards or punch lists.
To add a filter, from the dashboard page, click the + Add Filter button.
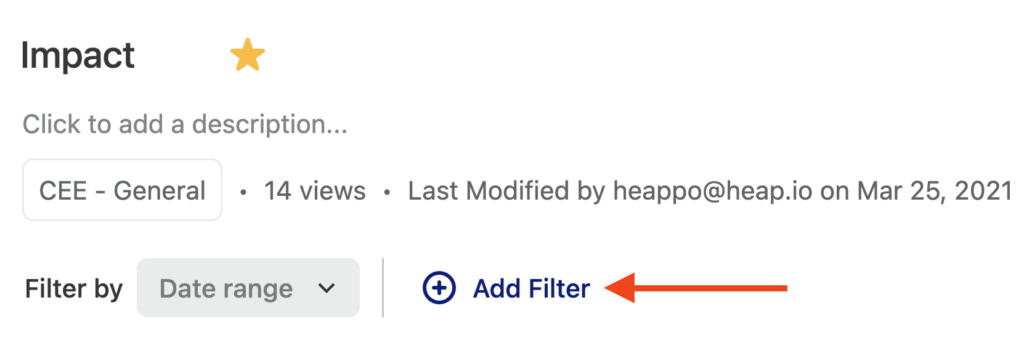
Select the property you want to filter by. Once you save your selection, you’ll be able to apply modifiers to the filter.
You can share a filtered dashboard by copy-pasting the exact URL of the dashboard, which will include the filters you’ve added.
Note: Dashboard filters are currently not set up to support Behavioral Properties or funnel conversion windows.
Dashboard templates
Dashboard templates automate the creation of dashboards by pre-populating useful charts based on your use case.
To create a dashboard via a template, complete the following steps:
- Navigate to Dashboards and click the New dashboard button at the top of the dashboards tab. Click Explore templates and choose a template that best matches your use case. In the example below, we selected the Acquisition overview template.
- After you’ve selected a template, you’ll be prompted to select definitions that correspond to your use case. If you don’t have an existing event for these fields, you can create a new event by clicking Define new. For certain properties, you can select the default property that comes out-of-the-box when you install Heap.
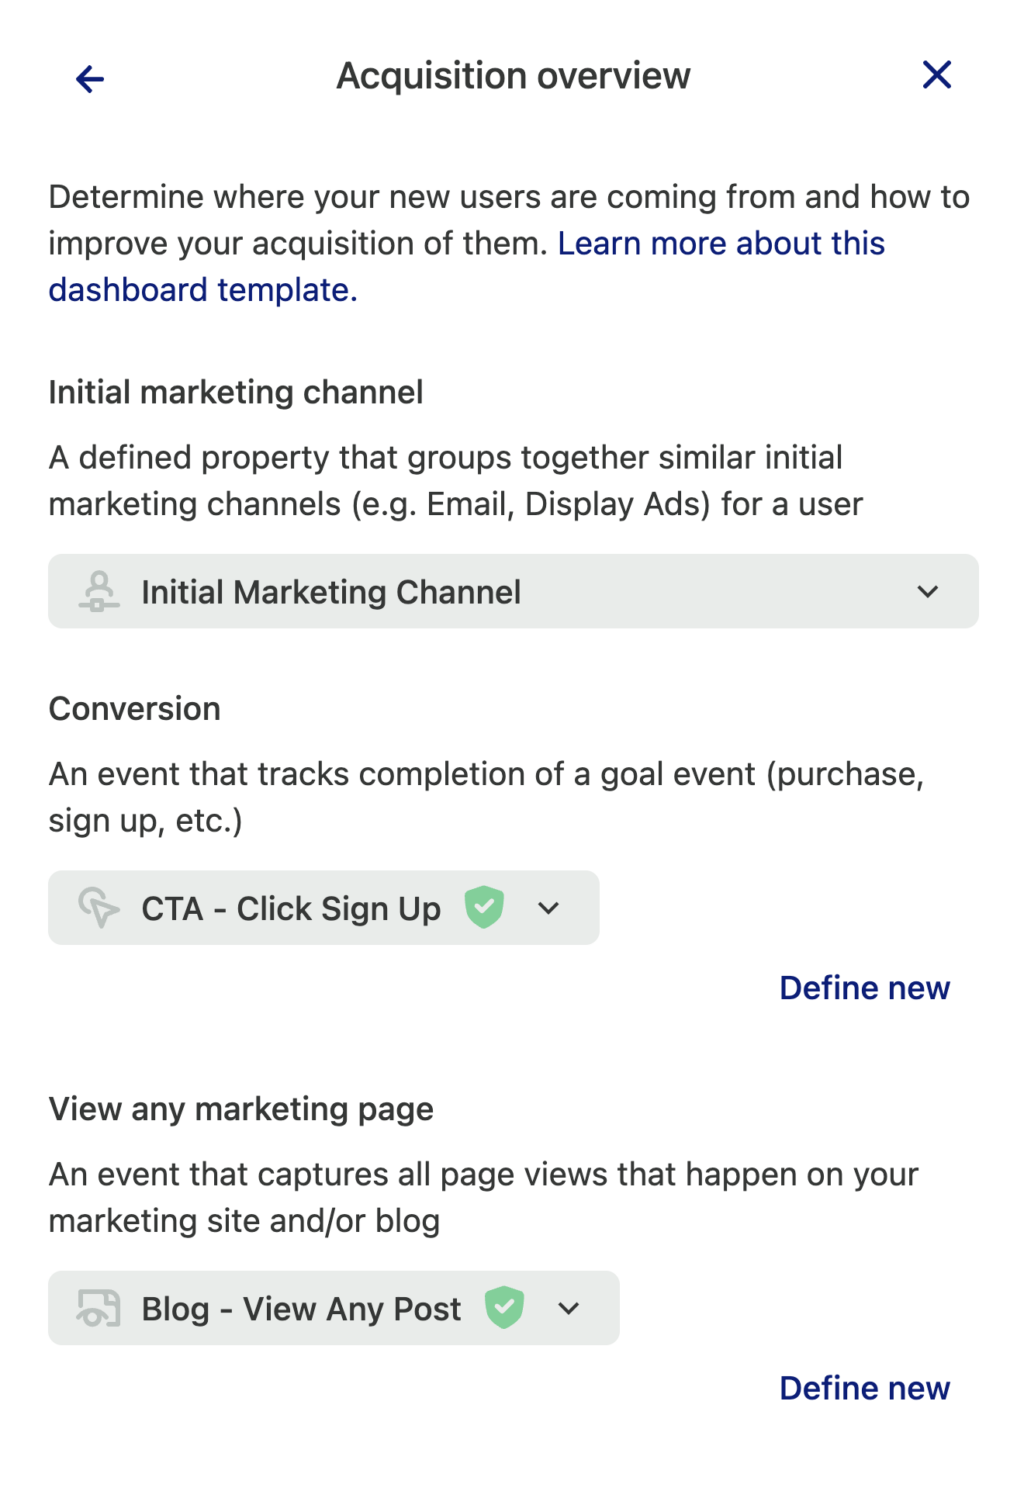
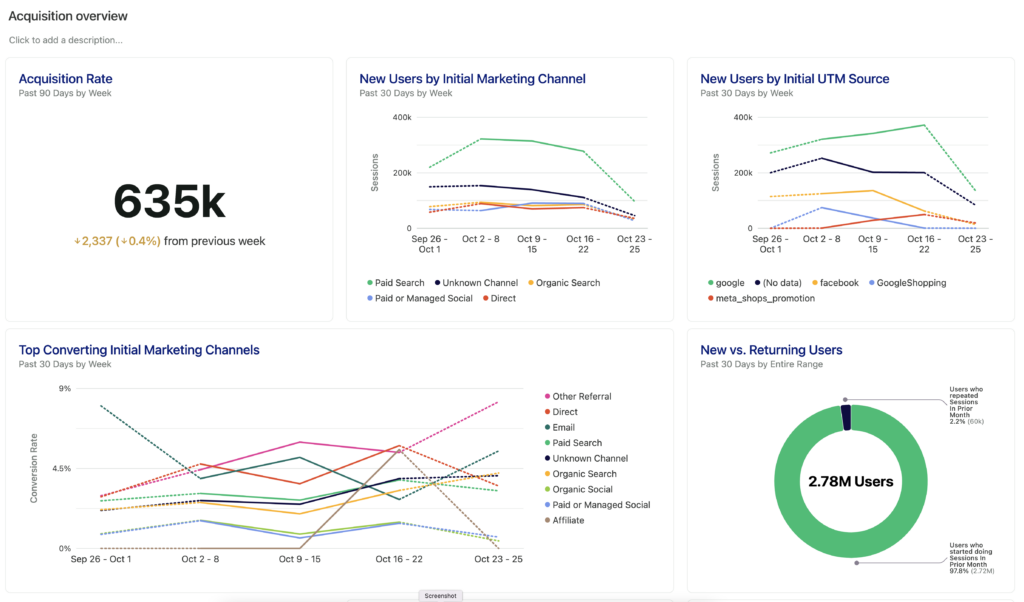
- Once you’ve made your selections, the dashboard will automatically populate with the relevant charts. You can continue to edit the events you’ve selected until you are satisfied. Once you are happy with your selections, click Save Dashboard to save your new dashboard!
With your new dashboard in place, you can add charts, customize individual chart settings, recategorize it to align with your organization’s categories, and more. The steps for doing so are the same as for any other dashboard, so see the Managing Dashboards section above for more info.