User Segments
Analyzing repeat user behavior is crucial for growing your active user base. DAU, WAU, and MAU metrics don’t tell the whole story behind active usage — they might tell you if active usage is growing, declining, or steady, but they don’t tell you why or what to do next.
To understand the “why” behind active usage of a particular feature, Heap provides active usage properties to help you analyze the four types of users:
- Users who have just started using the feature
- Users who have consistently used the feature
- Users who have recently stopped using the feature
- Users who are re-engaging with the feature after a break
Understanding the breakdown of these segments is key to building a strategy for user growth and retention. Heap lets you directly analyze these segments for any feature in your product (or your product as a whole) and combine these segments with other analyses.
These segments are defined based on a comparison between your user’s latest activity and their activity in the past, as read from right to left in the images below.
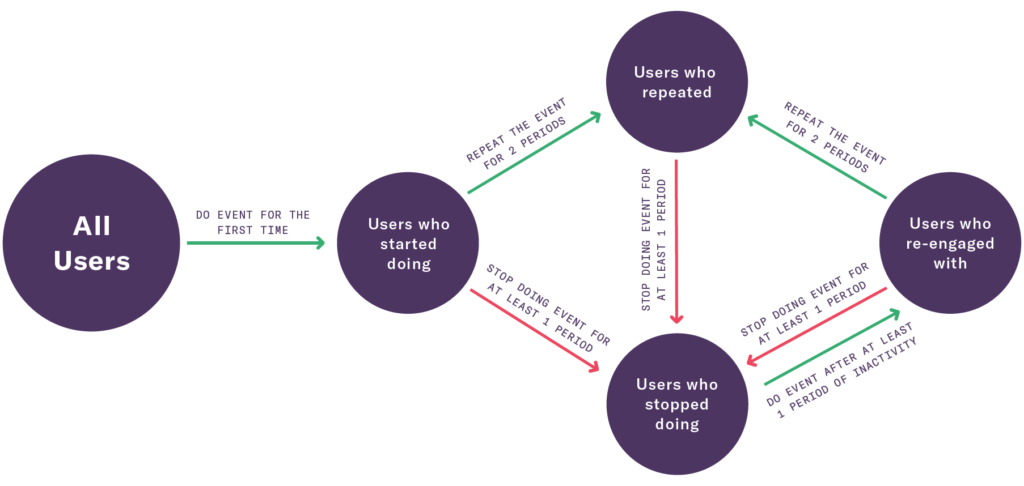
Users who started doing have recently completed the target event for the first time.

Users who repeated are users who have done the event consistently for the most recent two periods of usage (in this case, the most recent two weeks).

Users who stopped doing have previously completed the event, but recently have stopped doing so.

Users who re-engaged with have done the event sometime in the past, then stopped doing it, then recently began doing it again.

These segments are dynamic, and your users will continue to shift between them indefinitely. The following diagram demonstrates how your users are classified into each of these segments based on their most recent engagement. The arrows indicate the pattern of behavior that occurs that leads a user to move from one segment to another.

To leverage these segments to grow your active user base, Heap provides a set of features and charts to allow you to conduct active usage analysis. Using Heap’s user segments within chart templates and your own analyses, you can examine user engagement patterns to discover what patterns lead to user growth and encourage them.
Break Down Active Usage
To start, you’ll need to understand where your active usage comes from today. We’ve created a chart template to allow you to quickly analyze this behavior using any event: What is the actual makeup of my active user base?
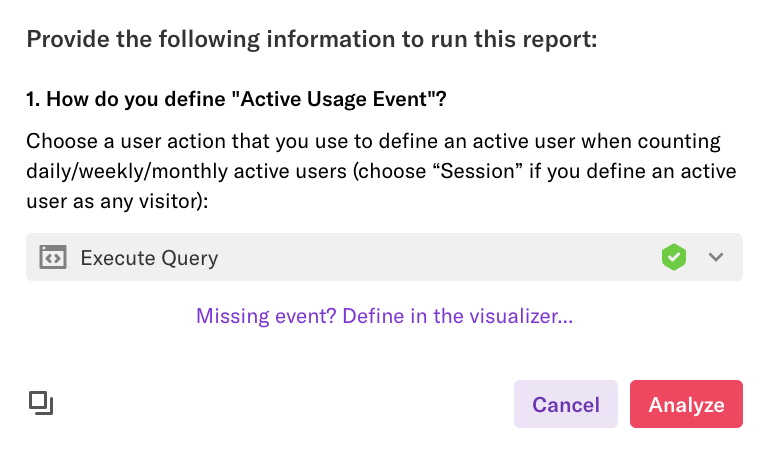
This allows you to get a high-level overview of all of your current active usage based on the Active Usage Event you create. This can be user interaction with a feature, section of your app, or a page of your website.
As an example in Heap, we might define active usage as a user running a chart in any of our analysis modules.

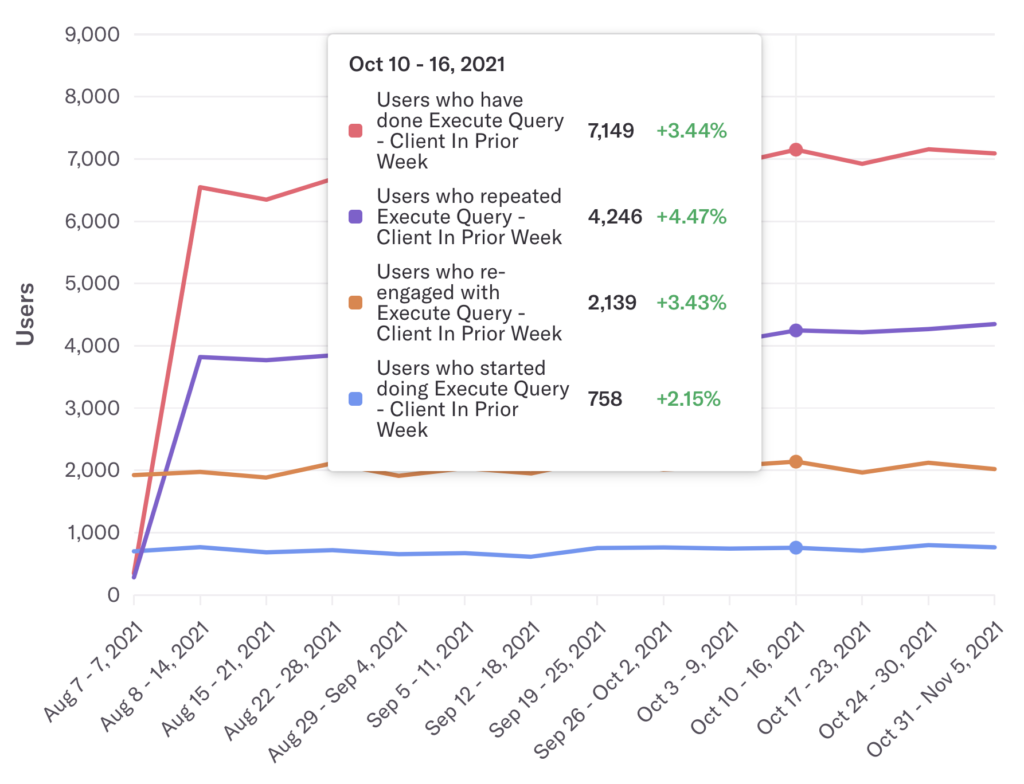
In the chart that appears, the three smaller lines all add up to the top line, which represents your active usage.

Based on which active user segment is the largest, choose your next step below.
Active Usage is Mostly New Users
If most of your feature usage comes from new users, this means that many users are trying your feature once, but not sticking with it. This presents you with an opportunity to re-engage with and convert them to retained users.
To discover what users you can bring back, use the chart template How many users can I re-engage? This will show you how many users have recently stopped using your feature versus the total active users of your feature. If a large fraction or more of your users have recently stopped, you have a big opportunity to grow your active user base by targeting re-engagement campaigns to this segment.
Active Usage Is Mostly Repeat Users
If most of your feature usage comes from repeat users, there’s an opportunity to leverage the data you have on the repeat user experience to acquire more new users, as opposed to trying to squeeze out more engagement from your already-active users.
Active Usage Is Mostly Re-engaged Users
If most of your feature usage comes from users returning after a break, your next step is to understand why these users re-engaged in active usage and use this information to bring back even more of your inactive users.
It may also be the case that your existing marketing efforts have won these users back. To check what specific re-engagement efforts worked, use the chart Which email campaigns convert at the highest rate?
Using These Properties in Analysis
To recap, the active usage properties available for you to use in analysis are:
- Users who started doing: users who recently completed the target event for the first time
- Users who repeated: users who have a recent history of doing the event more than once within a given time frame
- Users who stopped doing: users who previously completed the event, but have recently stopped doing so
- Users who re-engaged with: users who have done the event sometime in the past, then stopped doing it, then recently began doing it again
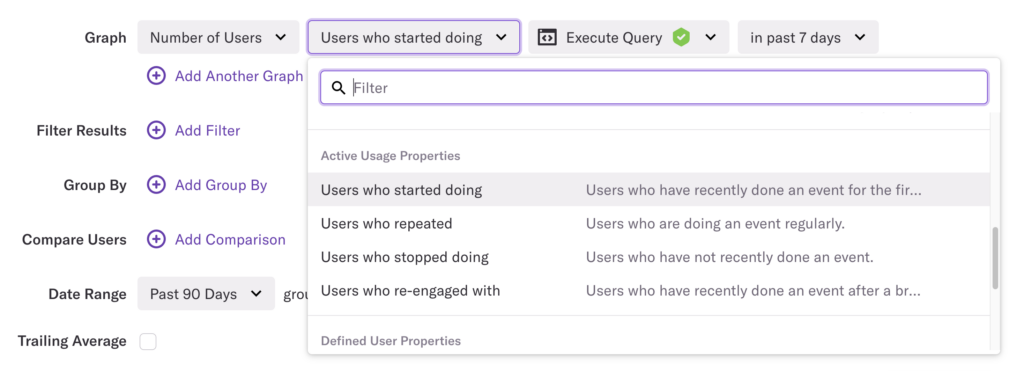
When using the usage over time chart, you can add these segments into your analyses by charting Number of Users > Selecting one of the segments listed above.

Add additional charts to make this a multi-event chart comparing user segments by clicking the + Add another button.
Uniques vs. Number of users
“Number of users who have done [an event] in the last 7 days” is different from “Count Uniques by week”. The former aggregates usage going back exactly 7 days from the time that you run the chart, and the latter aggregates user behavior for a week starting at midnight in your account’s time zone. This will result in slightly different values at each point in time for these two types of charts.
When doing active usage analysis with the segments mentioned above, you should always use “Number of users who have done [an event] in the last 7 days”.
Customizing Usage Interval
The segments described above assume that you are analyzing your daily, weekly, or monthly active usage, though Heap allows you to also analyze behavior repeated at a rate of your choosing.
You can use the usage interval view in Heap’s Retention module to understand how often users are naturally repeating a given active usage event (we call the amount of time between repeat uses of an event the “usage interval”). You can use this usage interval when setting up your active or inactive user segments.