Overview
Period over period analysis allows you to compare a recent time period to the same time period in the past. You can use this information to answer questions in Heap such as:
- Has my conversion rate improved since this time last quarter?
- Has user behavior increased or decreased in response to recent product updates?
Funnel Analysis
To set up period over period analysis in a funnel, navigate to Analyze > Funnel, set up the steps of your funnel, then click the + Compare to previous date range button to the right of the date range.

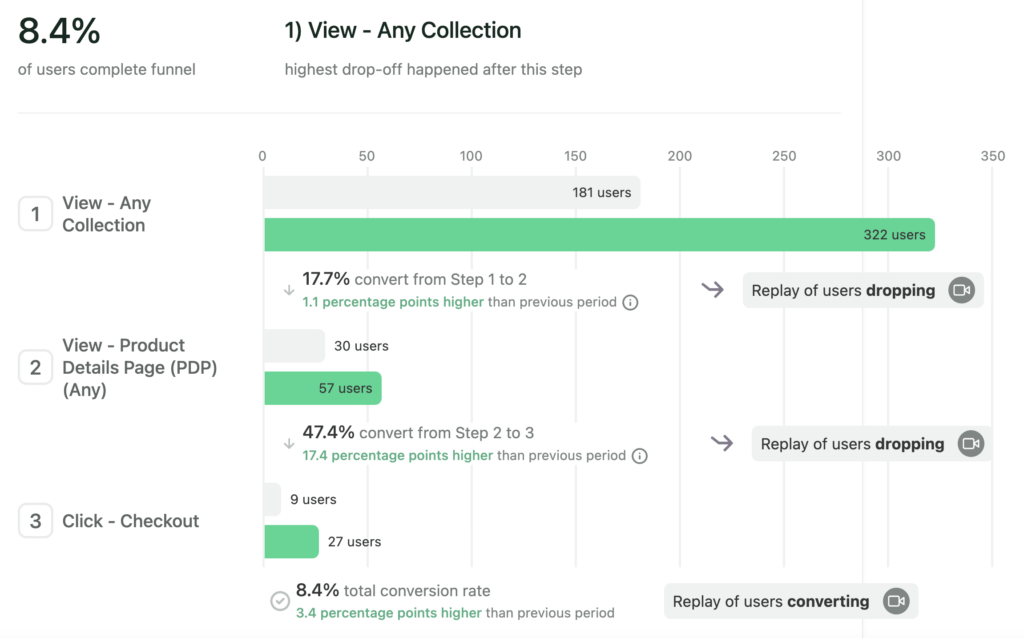
Once you click View results, your funnel will update with two bar charts for each step depicting the number of users for this step in the previous time window (top bar) and the number of users for this step in the current time window (bottom bar). This allows you to examine each step to see if engagement increased or decreased between now and then.

How Date Logic is Calculated
When comparing corresponding data points, the Compare To Previous Date Range field selects the past window of time by choosing the closest equivalent to:
- Previous month: past 4 weeks
- Previous quarter: past 13 weeks
- Previous year: past 52 weeks
Conversion Rate Delta Percentage
The conversion rate delta percentage is the difference between conversion rate percentages. We calculate this as CVR_New - CVR_Old, and not CVR_New - CVR_Old/CVR_Old.
What does it look like when zero users have completed a step of the funnel?
Note that in cases where a conversion rate involves a division by zero, such as when a user does step 1 zero times and step 2 zero times, a conversion rate will not be displayed.
Usage over time chart
Period over Period analysis within usage over time charts allows you to compare a recent time period for a single-line usage over time chart to the same time period in the past, such as a recent hour, day, or week to a previous day, week, month, quarter, or year. You can use this information to compare current and past feature usage metrics, measure progress on KPIs, and much more.
Our comparison tool currently only works for comparing a day or week to a previous day, weeks, month, quarter, or year. you cannot compare the past month or year to a previous time period.
To use period over period analysis in a usage over time chart, click the + Compare to previous date range button next to the date range field.

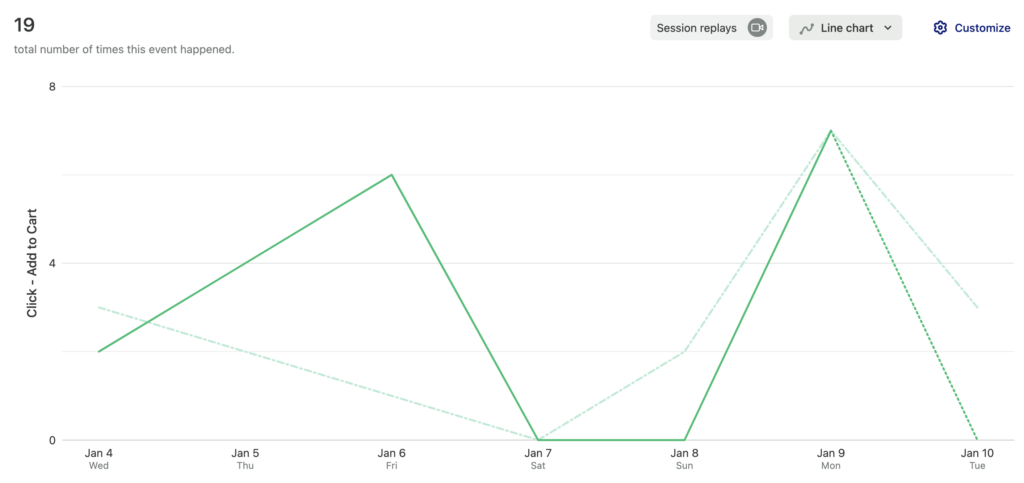
In the results, the solid line represents the current week, and the fainter line represents the equivalent previous week from the last time period.

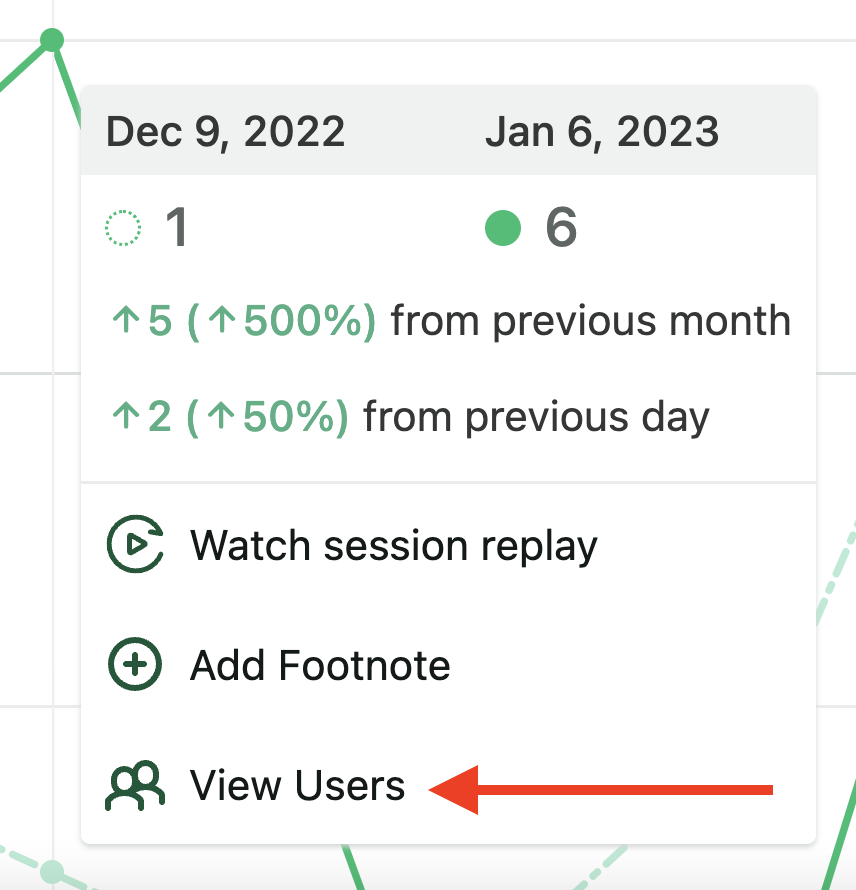
Hover over any point on the chart to see more information about that particular time frame. Click the View Users button to jump to more detailed information on the Users page.

Chart Templates
The following chart templates use period over period analysis to help you answer relevant business questions. Click on a template title to jump directly to that chart template in your Heap account.
- How has my conversion rate changed since last month?
- How has my conversion rate changed since last week?
- How has my purchase funnel changed since last month? (requires use of our Shopify integration)
- How has my order volume changed since last month? (requires use of our Shopify integration)
- How have my country demographics changed since last month?
- How have my device demographics changed since last month?
- Have the most viewed product categories changed since last week?