There are a few reasons why the total conversion rate in a Conversion rate between events chart may be different from the conversion rate seen in a funnel over the same time period.
Conversion window
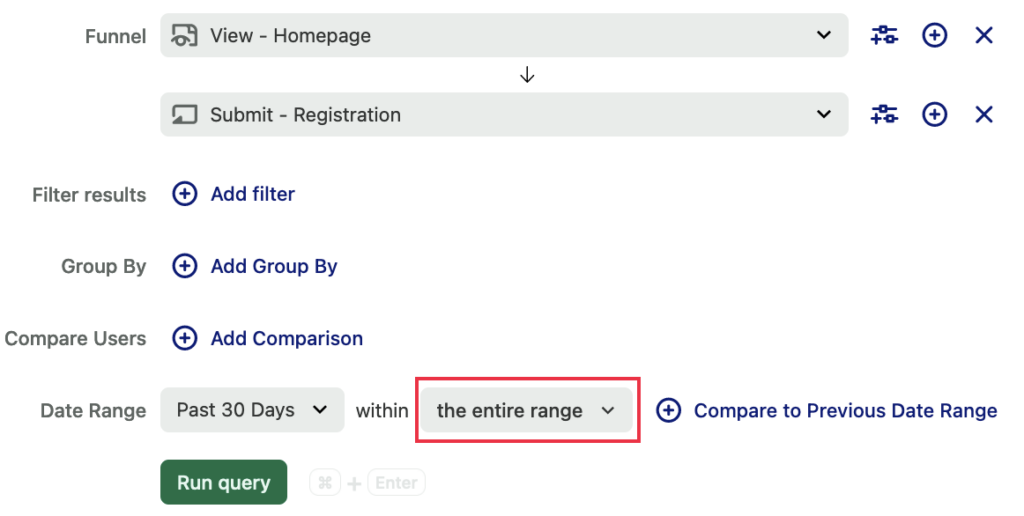
In a funnel, you can control the amount of time a user has to complete the sequence of events with the conversion window. We have found that the majority of funnels will have a conversion window of the entire range:

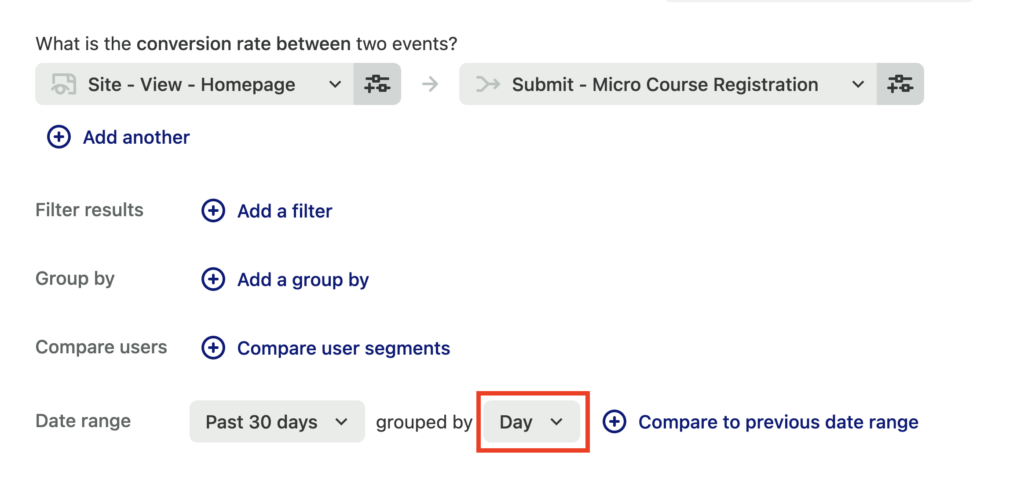
In a conversion rate over time chart, the granularity of the chart (how the date range is grouped) controls the conversion window:

In the funnel above, users have 30 days to complete the conversion, whereas in the conversion rate between chart above, users have one day to complete the conversion. Switching the granularity in the conversion rate between chart to entire range will likely yield the same conversion rate as the funnel.
It is important to note, however, that the converse (changing the conversion window of the funnel to a day in this case) will likely not match the total in the conversion rate over time chart. This is due to the fact that users can only ever be counted once in a funnel, whereas in a conversion rate over time chart a user can be counted once per time period (day, in the case of the example above).
There are a number of situations in which a user could be counted multiple times in the conversion rate between chart, for example:
- If the user does the sequence of events within 24 hours, but converts over a date boundary (ex. did the first event yesterday and the second event on today), then the user will be counted as not having converted yesterday, the date of the first event, and will be counted as a conversion today, the date of the second event.
- If a user does the first event multiple times on multiple different days, they will be counted as not converting on each day they do the first event.
- If a user does the sequence of events multiple times on multiple different days during the date range, they will be counted as a conversion on each day in which they convert.
Number of steps
The conversion rate between chart shows the conversion rate between two events. If your funnel includes more steps between these two events, there may be users who have completed the two events in the conversion rate between chart, but not all of the intermediary steps included in the funnel.