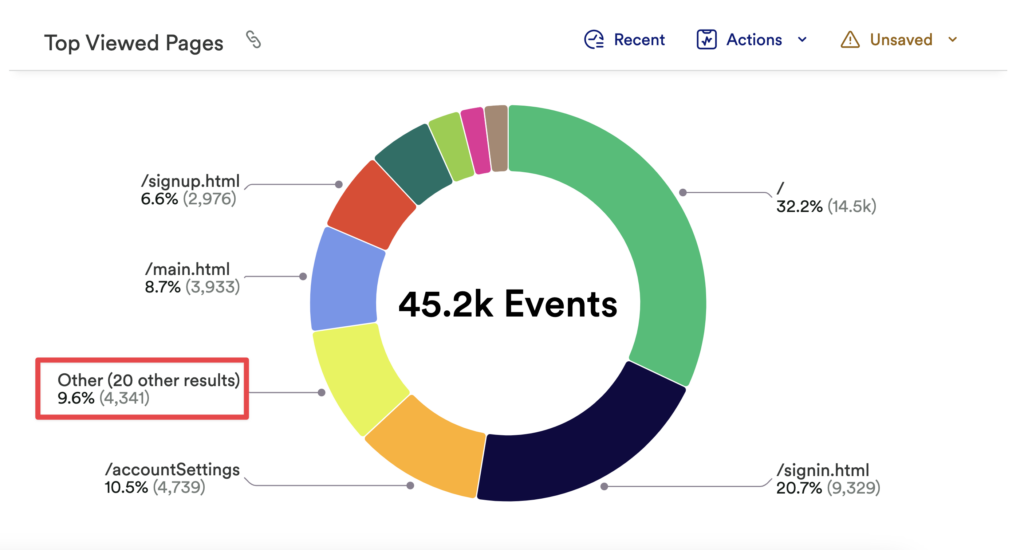
Other is where all of your analysis results that were too small in number to be displayed as part of your chart are listed.
When a group by is used within a chart in Heap, the usage over time chart view will typically display the top ten groups and then combine the remainder of groups into the Other section.
The table view will display the top 100 groups and combine any additional groups into the Other section. If you are grouping by 6 or more metrics, we will display fewer groups in the table view.
If there are more than 100 groups that meet the chart criteria, exporting the chart to CSV will allow you to see up to 100,000 rows, or groups, of data. To do so, click the Actions menu and select Export result to CSV.
For more information on Usage over time analysis results, see our Usage over time analysis overview guide.