The group by clause allows you to break down analysis even further by creating up to 4 groupings within charts based on user and event-level properties.
Group by User-Level Properties
How does it work?
Heap automatically captures certain user properties, such as date first seen and other initial properties. A full list of all properties which are automatically captured is available in Autocaptured Data. You can also create additional properties, such as account type, LTV, and more using our addUserProperties API.
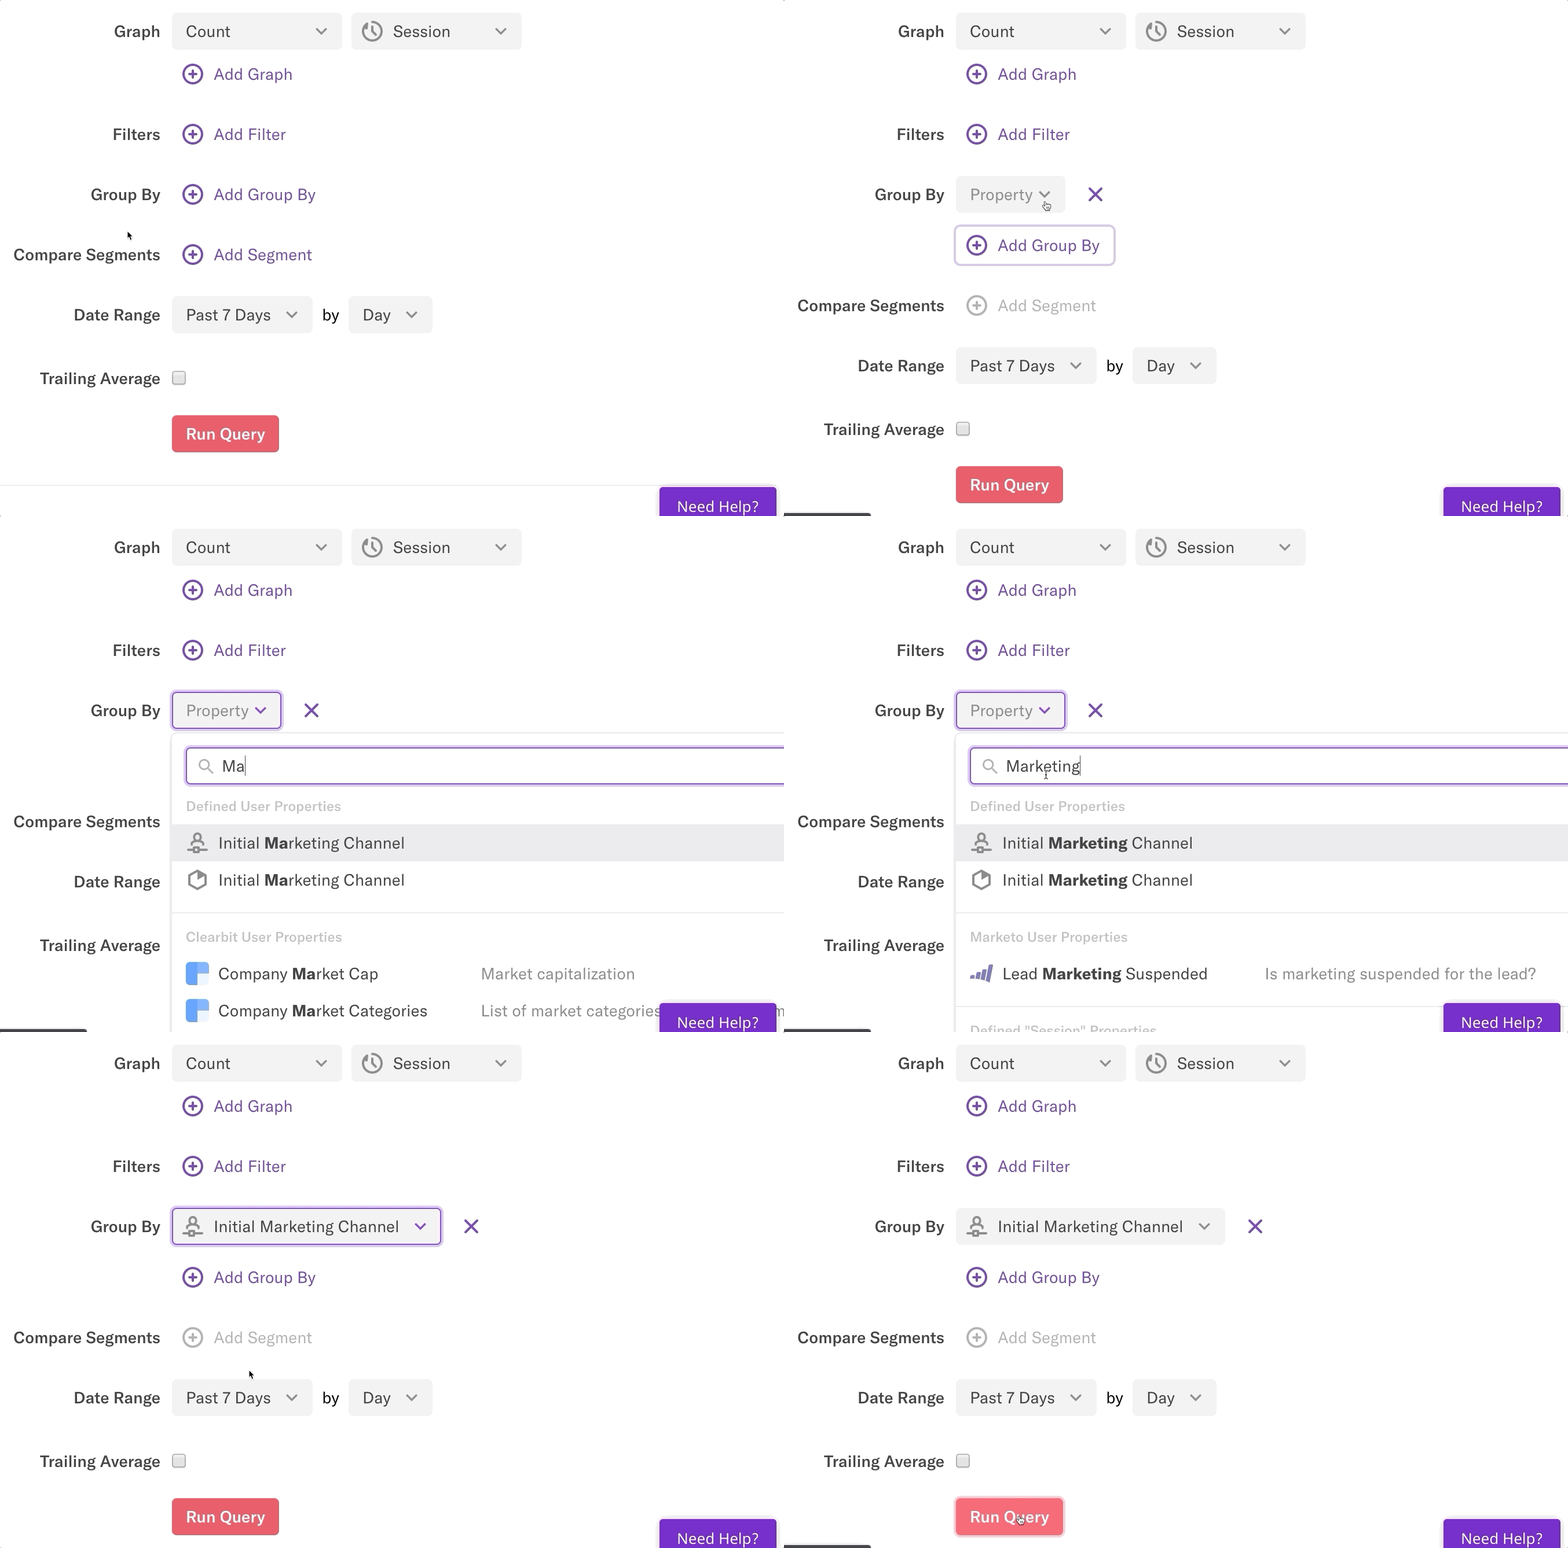
To segment your analysis by one or more of these user-level properties, click the + Add Group By button and select your property.
Why is this powerful?
Grouping by a user-level property allows you to get an in-depth picture of who is using your product.
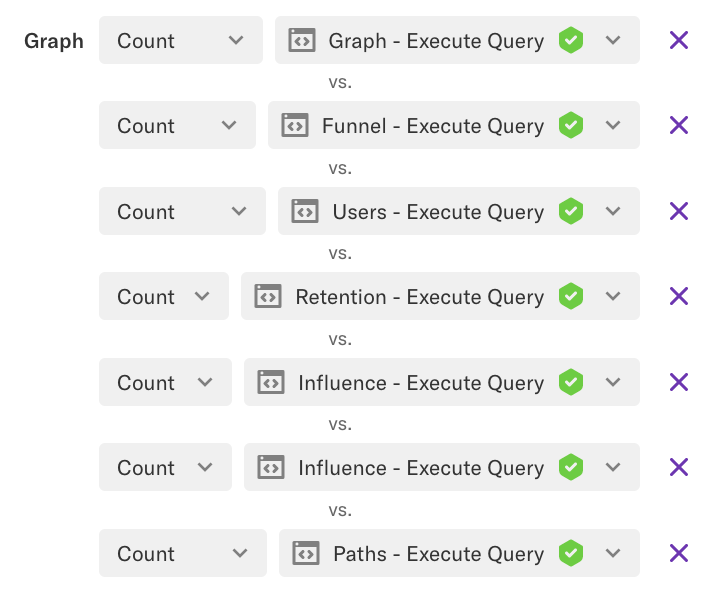
As an example, within Heap, there are six analysis tools. Using a multi-metric chart, we can compare how frequently each of these features is used, which helps our product team prioritize which features to work on.
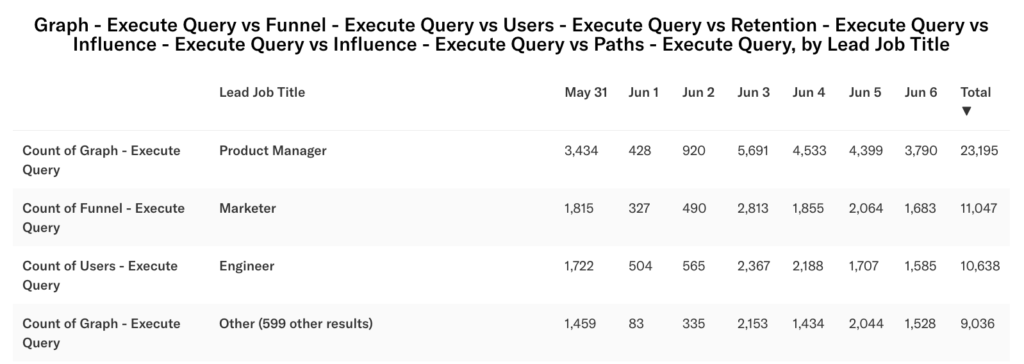
When we group this multi-metric chart by job title, we are not only comparing which features are being used most frequently, but also comparing who is using them. A marketer needs a different feature set than someone in sales or design.

This provides actionable insight into how we should prioritize our features and who we need to build features for.
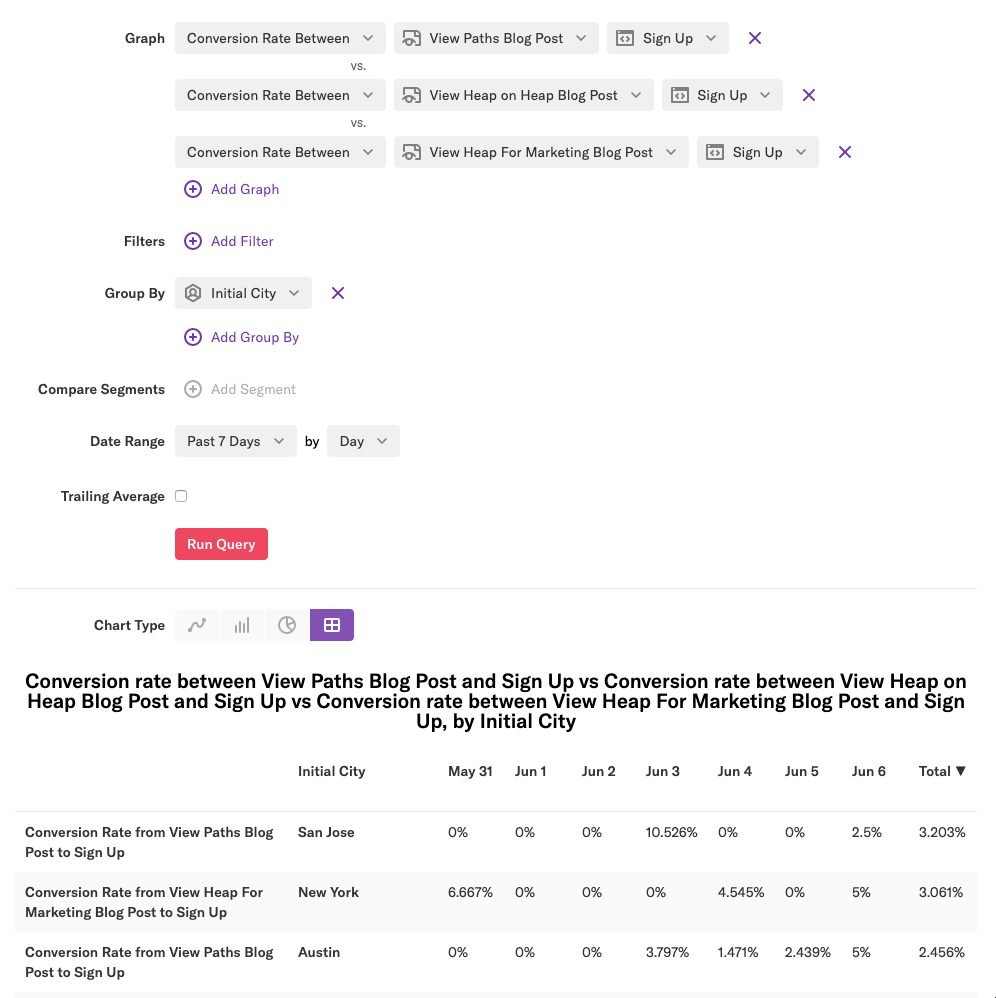
You can also use a multi-metric chart + a group by to compare the effectiveness of different campaigns, landing pages, blog posts, and more across different groups of users.
In this example, we can compare three blog posts and their conversion rate for signups based on the region. Looking at the results, it’s clear that some posts are more effective than others in different regions. This enables our outbound team to adjust their strategy when getting prospects to sign up for Heap.
Group by Event-Level Properties
When using funnels, conversion rate over time, and average time between, you can segment your data by grouping by an event-level property.
How is the conversion rate calculated?
When you group by the property of the first event in a funnel (or any intermediate event), we calculate the conversion rate by bucketing the user into the instance of the event immediately before a conversion.
If the user has not completed the rest of the funnel, we use the most recent value of the event’s property. Each user will only be included in one bucket, and if a user completes a funnel multiple times, we’ll use the data from their first conversion.
For example, in an A→ B→ C funnel:
- Bob does event A with path /home, event A with path /blog > event B > event C
- Tammy does event A with path /home
- Beth does event A with path /home > event B > event C
The results will be as follows:
| A | B | C | Total Conversion | |
|---|---|---|---|---|
| /home | 2 | 1 | 1 | 50% |
| /blog | 1 | 1 | 1 | 100% |
When you group by the properties of the last event in the funnel, users will be bucketed into categories based on the first instance of the last event (the first conversion). As above, each user will only be included in one bucket, and if a user completes a funnel multiple times, we’ll use the data from their first conversion.
For example, in the funnel A → B:
- Bob does event A > event A > event B with Referrer Google, B with Referrer Facebook
- Tammy does event A > event B with Referrer Facebook
- Beth does event A
The results will be as follows:
| A | B | Total Conversion | |
|---|---|---|---|
| 1 | 1 | 100% | |
| 1 | 1 | 100% | |
| None | 1 | 0% |
Where can I group by event-level properties?
You can group by event-level properties in the chart (including average time between and conversion rate between charts) and in the funnel chart type.
How do I use grouping by event-level properties to find actionable insights?
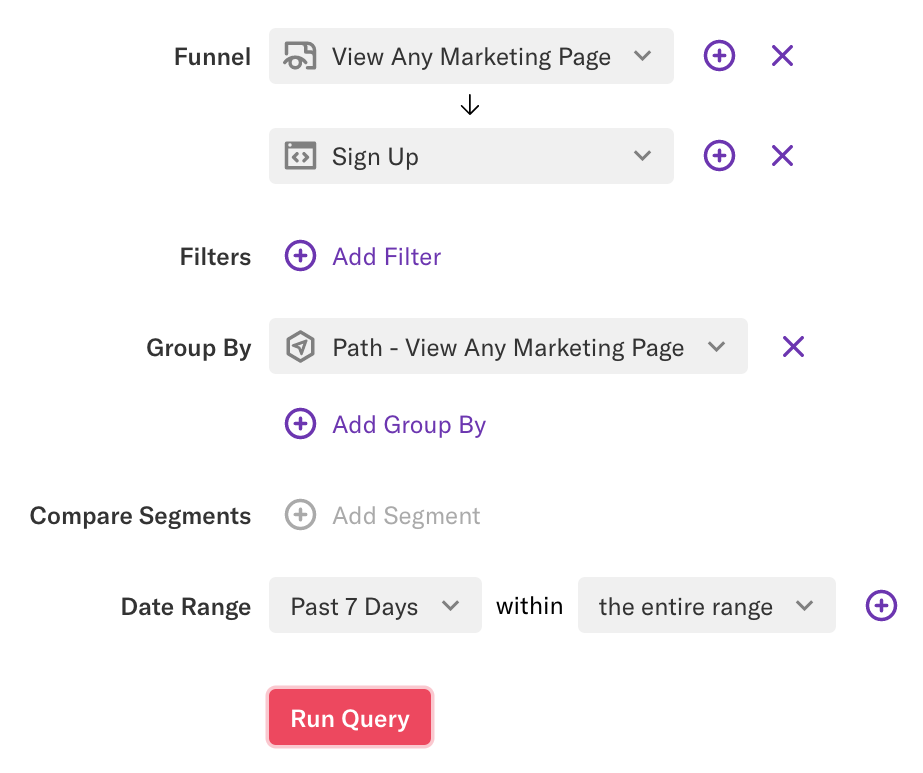
Grouping by the first or intermediate step of a funnel provides insight into what was happening immediately before the conversion. In this example, we compare the effectiveness of different marketing pages by grouping by the marketing page immediately preceding the Sign Up event.
This example can be adapted to see which collection was viewed before checking out, or which product was viewed before adding to the cart.