Overview
Acquisition analysis helps you quickly understand how users are reaching your site or app.
This can help you answer questions like:
- Which campaigns (UTMs) are performing the best?
- What is the bounce rate and conversion rate across all our product description pages (PDPs), grouped by marketing campaign?
Set up an acquisition chart
Navigate to Analyze > Acquisition (this may be behind the More menu).
By default, the chart will show you acquisition metrics grouped by Initial Marketing Channel, over the Past 7 days.
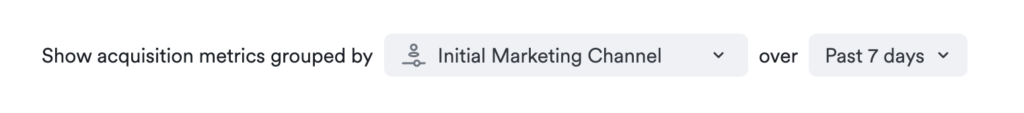
In the grouped by drop-down, you can choose a user property or session property.
Advanced options
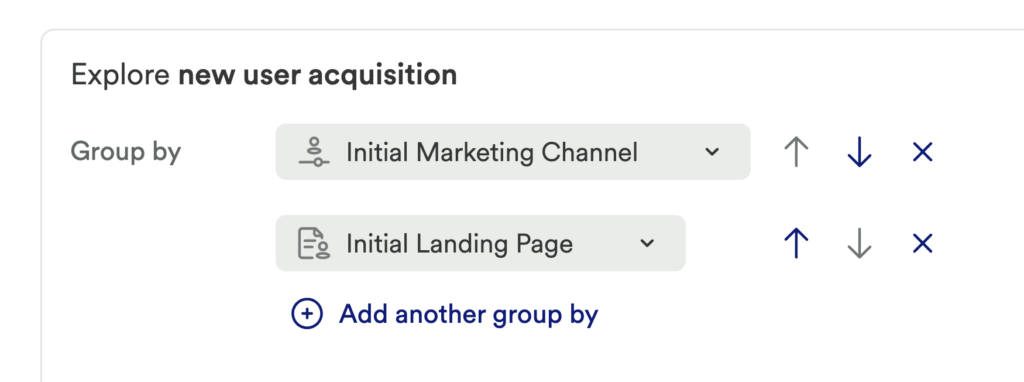
Click Advanced to access additional options, such as multiple group bys, filtering, and the option to pick a specific conversion event.
Grouping by multiple properties can help you further refine your analysis. For example, you may want to group by Initial Marketing Channel and Initial Landing Page to see exactly where users are coming from and where they are landing on your site.
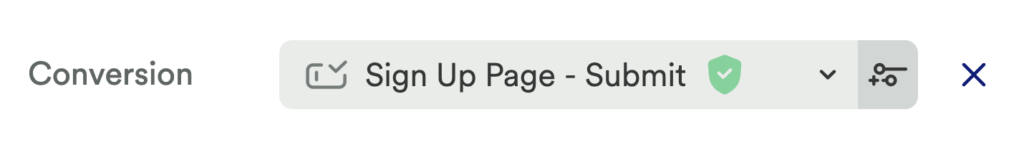
In the Conversion drop-down you can pick the conversion event that’s meaningful to your business. Picking a conversion event will add Total, Converting users, Conversion rate, and New user conversion rate columns to your chart.
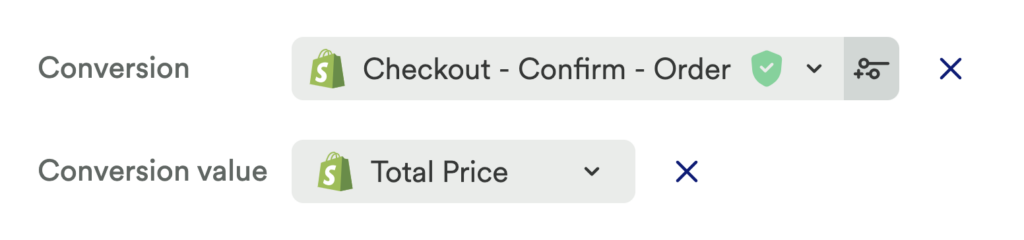
The Conversion value field is valuable if there is a numeric value associated with your conversion event. For example, if you are an e-commerce site, the conversion value can be the total amount of money collected from purchases. Picking a conversion value will add Value, Value per conversion, Value per user, and Value per session columns to your chart.
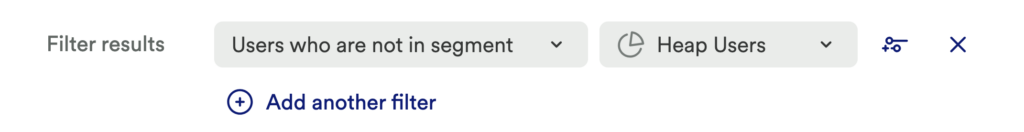
You can also add filters to only see results for certain segments of users. For example, you may want to filter out your company’s users from your results. At Heap, we have a segment that represents all Heap employees so that we can exclude ourselves from analysis. To learn more about creating a segment that represents your company’s users, see the Segments overview guide.
Understanding your results
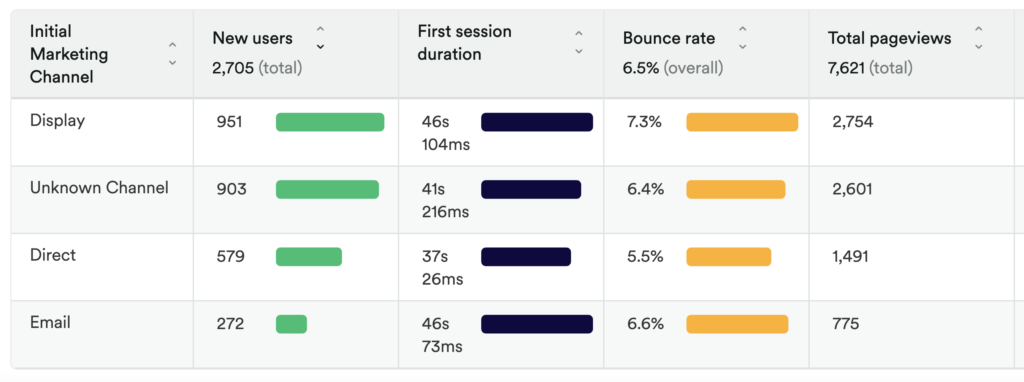
When looking at an acquisition chart, you can use the table to find outliers in your user acquisition that might merit more exploration or follow-up analysis. In the example below, we can see the Direct Initial Marketing Channel has the lowest First session duration but also the lowest Bounce rate.
This could be a good starting point to look into that group more and see if one Referrer was contributing to this, and why.
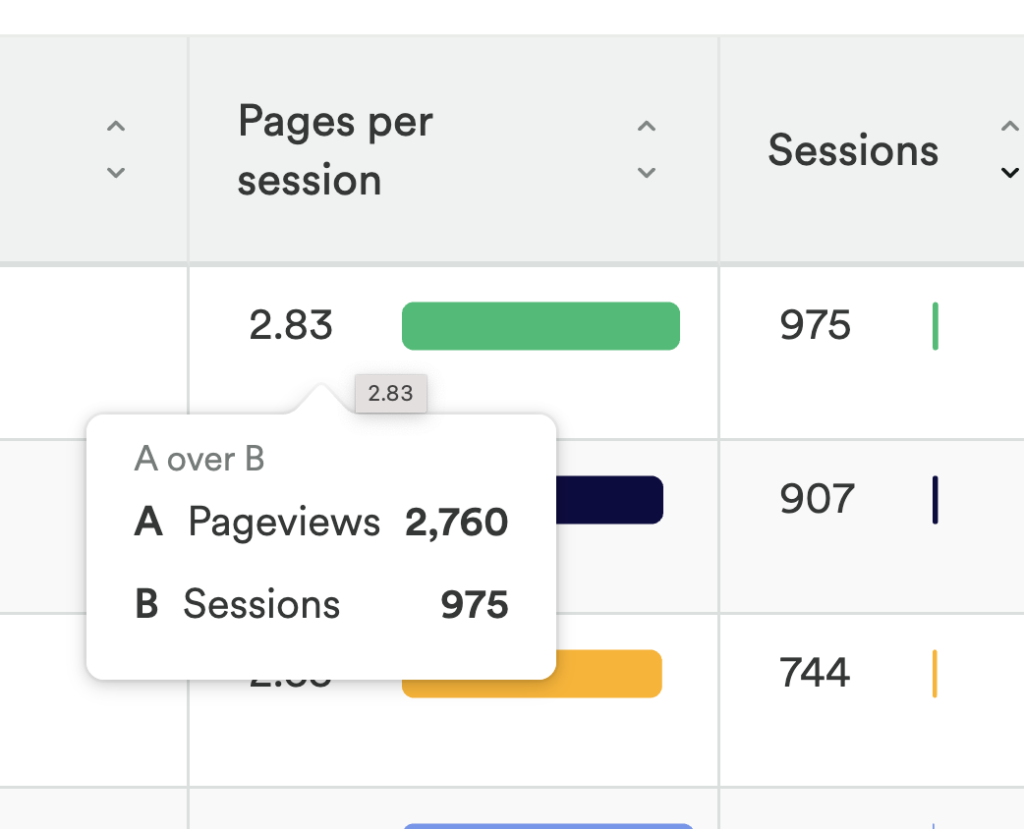
To see how different rates are calculated, hover over the number.
How are results calculated?
Users
All
Number of unique users in the date range.
New
Number of unique users whose date first seen is in the date range.
Engagement
Sessions
Number of sessions in the date range.
What is a session?
A session in Heap is a period of activity from a single user in your app or website. It can include many pageviews or events. On web, a session ends after 30 minutes of pageview inactivity from the user. On mobile, a session ends after 5 minutes of inactivity, regardless of whether the app’s background or foreground state.
Bounce rate
Percentage of sessions in the date range that immediately exited with no interactions.
A bounced session is defined as a session with a single pageview and no clicks. A single user can have multiple sessions in which they bounced. Bounced sessions have 0 duration when calculating session duration.
To set up a Heap Connect query equivalent to a bounce rate acquisition chart, see Bounce Rate.
First session bounce rate
Percentage of first sessions within the date range that bounced.
Session duration
Median duration of all sessions in the date range.
Sessions with 0 duration are not included when we calculate the median session duration.
First session duration
Median duration of first sessions within the date range.
This excludes first sessions that were bounced sessions. If all the sessions are bounced sessions, this metric will display as “–” in the chart.
To find a single session’s duration, Heap looks at the timestamps of the pageviews, clicks, and touches within a session and computes the difference between the last and first timestamps seen.
For example, if a user first views a page at 3:00pm and then has their last interaction at 3:02pm, then the first session duration will be 2 minutes.
Time engaged
Median time engaged for all sessions within the date range.
Time is considered “engaged” when there’s at least one pageview, click, or touch within 60 seconds. Time spent away from the computer is not counted (ex: if they step away from the computer for an hour in between clicks).
Sessions with 0 time engaged are not included when we calculate the median time engaged.
First session time engaged
Median time engaged for first sessions within the date range.
Time is considered “engaged” when there’s at least one pageview, click, or touch within 60 seconds. Time spent away from the computer is not counted (ex: if they step away from the computer for an hour in between clicks).
Sessions with 0 time engaged are not included when we calculate the median time engaged.
Sessions per new user
Number of sessions from new users divided by the number of new users.
Pageviews
Number of pageviews from all sessions within the date range.
Pages per session
Number of pageviews divided by the number of sessions within the date range.
Conversion
If you have a conversion event, your chart will have the conversion metric columns added. If you have a conversion value, the conversion value metric columns will be added to your chart.
Total
Number of conversion events within the date range.
Converting users
Number of users who have done the conversion event within the date range.
Conv rate
The conversion rate is the number of sessions with the conversion event divided by the number of sessions within the date range.
New user conv rate
Number of new users who have done the conversion event divided by the number of new users.
Value
Sum of conversion value property across all conversion events within the date range.
Value per conv
Value per conversion is the conversion value divided by the number of conversion events.
Value per user
Conversion value divided by the number of unique users within the date range.
Value per session
Conversion value divided by the number of sessions within the date range.