Overview
Funnel analysis measures the number of unique users who have performed a set of actions. You can use it to see dropoff and conversion in any multi-step process. This allows you to answer questions such as:
- What percentage of the people who come to my landing page end up signing up?
- Are my users making it all the way through the account creation flow?
Community Quote
“This is what I tell all the new Heap users at my company: learn how to use funnels (my favorite part of Heap) by purposely building a bad funnel first. Walk through the steps, see the weaknesses of the funnel and then make it better using effort analysis, so you can see where users drop off, you can see where things are a little bit wonky here and there. And then you can make your question better, and you can make your definitions better. It just improves the overall funnel experience.”
From I encourage new Heap users to create a bad funnel first
The following Chart Templates use funnel analysis. Click any link and populate the fields inside to quickly get up and running with your first funnel.
- Do users returning after a break convert at a higher rate than new users?
- How does use of a particular feature influence conversion and drop-off rates?
- How has my conversion rate changed since last month?
- How has my conversion rate changed since last week?
For an interactive course on how to mesaure the success of a feature post-launch, check out our Heap Use Cases | Measuring Feature Success course in Heap University.
For Heap Connect queries that allow you to conduct funnel analysis, see the Funnels section of our Heap Connect: Common Queries guide.
Setting Up a Funnel
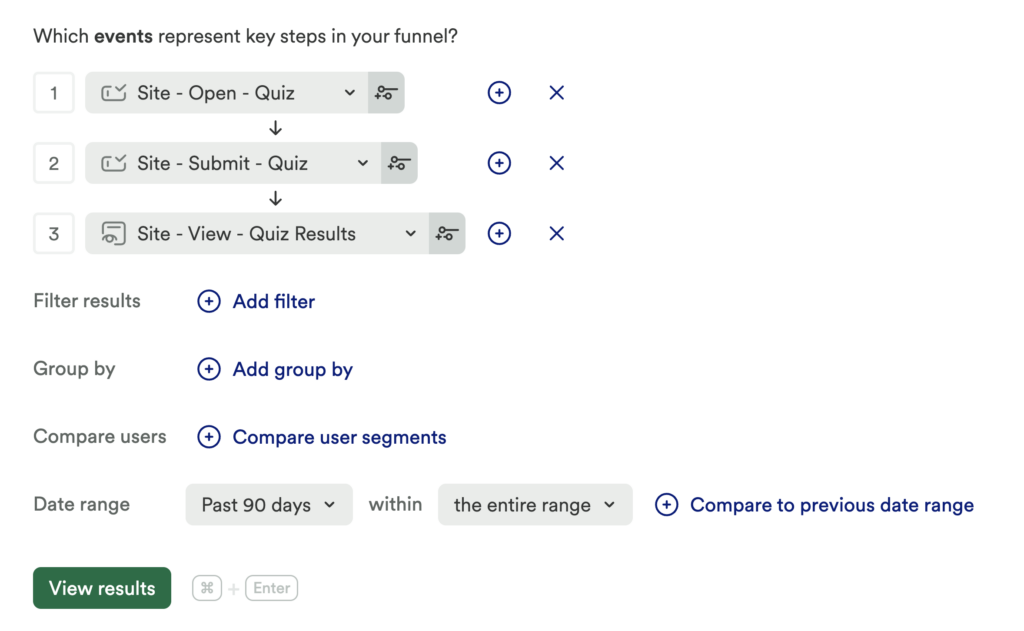
To begin, navigate to Analyze > Funnel, then add each of the events into your funnel steps. Use the + and x buttons to add or remove funnel steps. Click View results when you are ready.
User, account, or session funnel
Account-based Analysis (ABA)
Account-based analysis is only be available to customers on Pro and Premier plans. To upgrade, contact your Customer Success Manager or sales@heap.io.
When you create a funnel you have the option to create either a User, Account, or Session funnel.

All three measure conversion, but the User funnel looks at the conversion rate for individual users
An Account funnel looks at conversion rate at the account level. Each step in the Account funnel could be completed by a different user, but still counts as a conversion if all the users are in the same account. Account-level analysis may be especially interesting to you if you are a B2B SaaS company.
To change what defines an “account” for account-based analysis, go to Account > Manage > Account health analysis. Choose the appropriate property from the drop-down and click Save changes.
The Session funnel measures the conversion rate for the total number of sessions which completed the funnel steps regardless of whether they were completed multiple times by the same user.
User vs Session Funnel Example
Imagine a two step funnel from an “Add to cart” event to “Checkout”:
User 1:
- Session 1: Add to cart
- Session 2: Add to cart, Checkout
- Session 3: Add to cart, Checkout
User 2:
- Session 1: Add to cart
User 3:
- Session 1: Add to cart
- Session 2: Checkout
A Users funnel filtered on events completing “within a single session” would mean this would be counted as 1/3 users completing.
A Session funnel means this would be counted as 2/6 sessions completing.
Funnel example
Let’s say you want to see how many people view your quiz page, submit their answers, and then view their results. Make sure to label events for each of the step you want to include in the funnel. Once we’ve done that, we can build a funnel in Heap.
Run Query Hotkey
You can also press Command + Enter (Mac) or Control + Enter (Windows) to run queries.
Taking a look at the results, we see that 132k users viewed the quiz page over the past 90 days. Of these people, 36.3k users submitted the quiz after viewing it, and 30.6k users then looked at their quiz results.
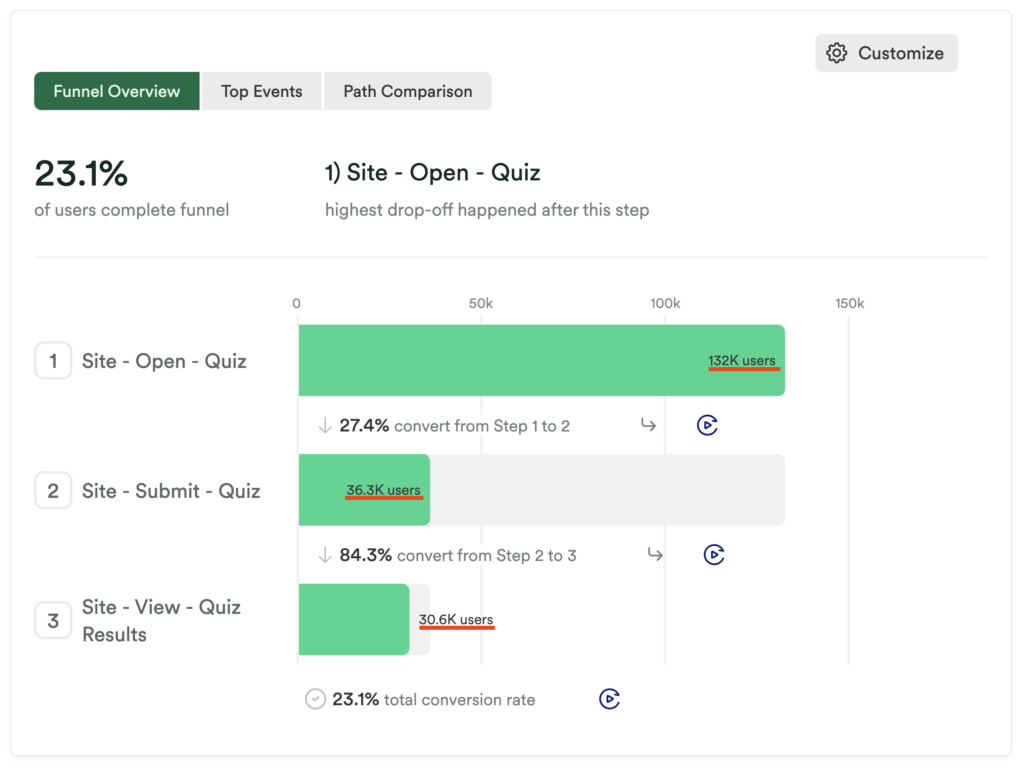
Heap presents the total funnel conversion rate at the top of the chart. In this case, the funnel conversion rate is 23.1%. This percentage reflects the number of quiz result viewers divided by the number of users that viewed the quiz page (30,600/132,000 = 23.1%). Heap also presents the conversion rate of each funnel step. For example, of the 36.3k people that submitted their quiz answers, 84.3% of them (30.6k) viewed their results.
It’s important to know that Heap funnels show unique users and not the event count. Also, users only appear once, even if they complete the funnel steps several times during the date range selected.
Heap funnels track users who complete a series of sequential actions at any point within the date range and conversion window defined. The steps don’t have to be immediately sequential: in the previous example, someone is still considered to be a conversion if they viewed another page between entering their email address and signing up.
Top Events
The Top Events section allows you to see the most common events after users complete a step in a funnel. This can help you better understand what your users are doing between each step and how these behaviors affect conversion.
If you have session replay turned on, you can also watch replays of these top events. For more information, see the section Watching replays of users dropping off and converting below.
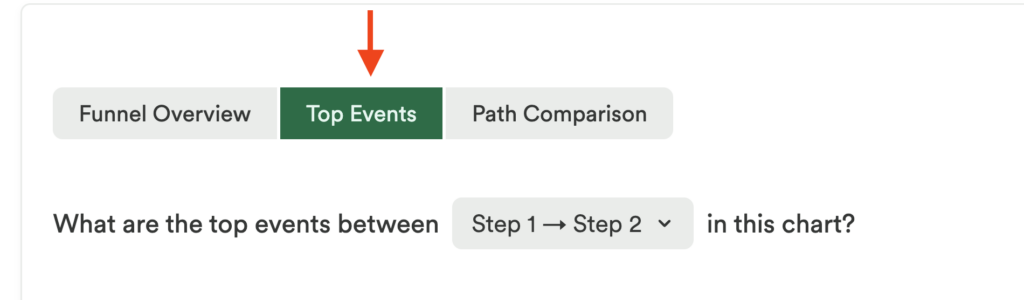
To switch over to the top events section, click the Top Events tab from within your funnel results. From this section, you can use the What are the top events between drop-down to select any combination of two events in your funnel.
Top Events Example
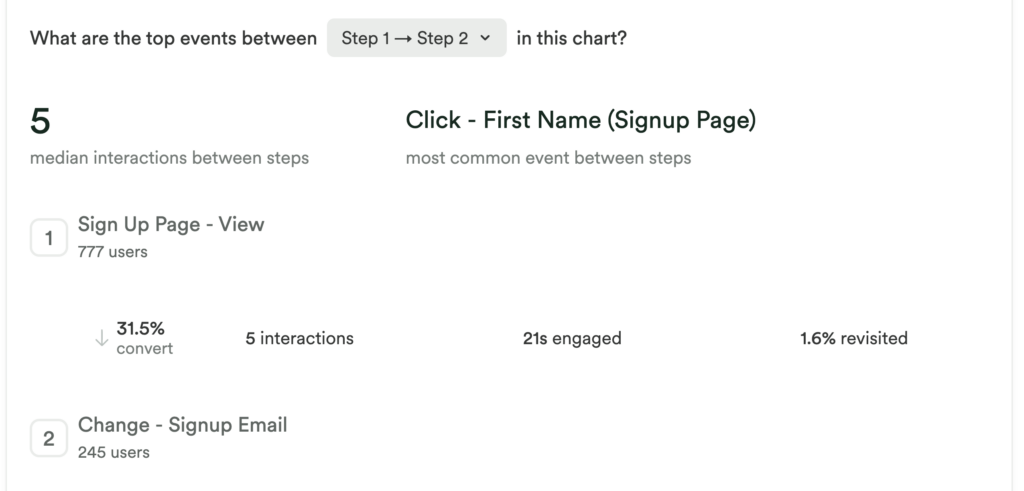
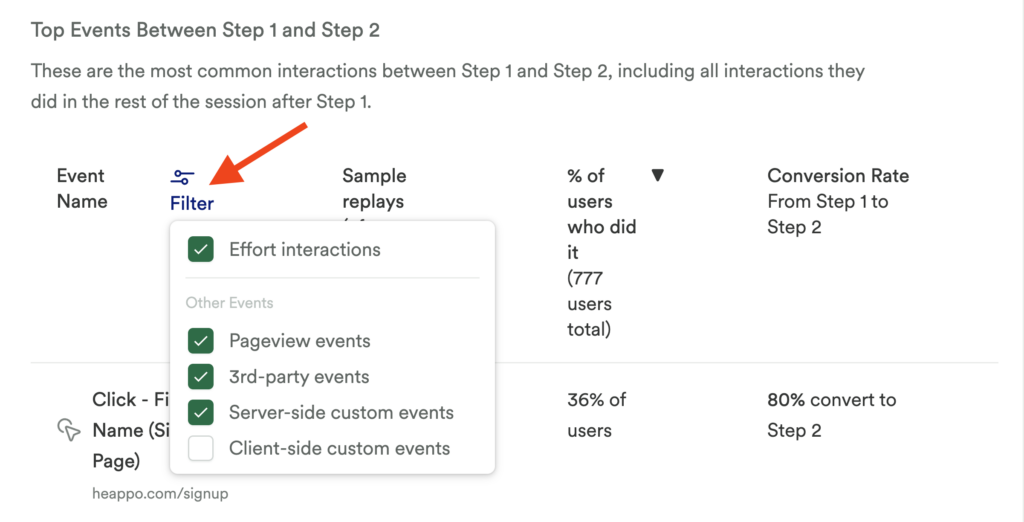
For example, in a signup funnel, the top events may include steps to complete the form fields. If you notice a step has a significant dropoff in comparison to the other steps, there may be an opportunity to make that step more clear to improve conversion. In our example, there are 5 median interactions between viewing the signup page and editing the email text box.
You can also filter by event category to include or exclude certain types of events, including pageview, third-party, server-side custom events, and client-side custom events. Note that when you save the chart, these filter settings will also be saved.
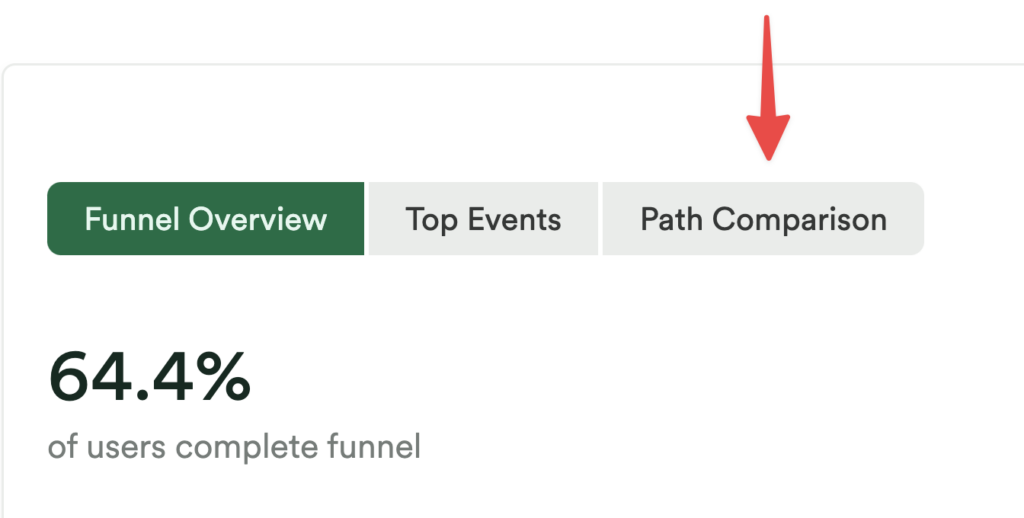
Path Comparison
The path comparison section allows you to see what percentage of users completed a specific “optional” event between two steps in a funnel. This allows you to gauge how well the path that included the optional step converted, and how it compares to the conversion of the path where users did NOT take the optional step.
To switch over to the top events section, click the Path Comparison tab from within your funnel results.
You can also click on any Top Event to jump to the Path Comparison between paths where users do vs. don’t do that event. Click on the event and select Compare to Alternate Journey
The results will show you which percentage of users completed the event after finishing the step.
What events are included in Top Events?
The following events are included in top events:
- Web events (pageview, submit, change, click)
- Mobile (iOS, Android, React Native) events (screen view, change, touch)
- 3rd party events (AppCues, Chameleon, Intercom, Shopify, Stripe)
- Custom (server-side) events
Note that we do not include client-side custom events.
What’s the difference between Interactions in Effort Analysis and Top Events?
Effort Analysis explicitly captures actions that involve user effort, such as clicks, changes to a form field, and opening a new page.
Top Events, surfaces a broader set of potential paths that a user could take between two points in a digital journey, and thus includes events like custom server-side events and events from third party integrations (e.g., viewing, an in-app guide, opening an email).
Effort Analysis
Under Funnel Overview, Effort analysis helps you understand why users are dropping off between funnel steps by surfacing three signals that indicate where they might be struggling.
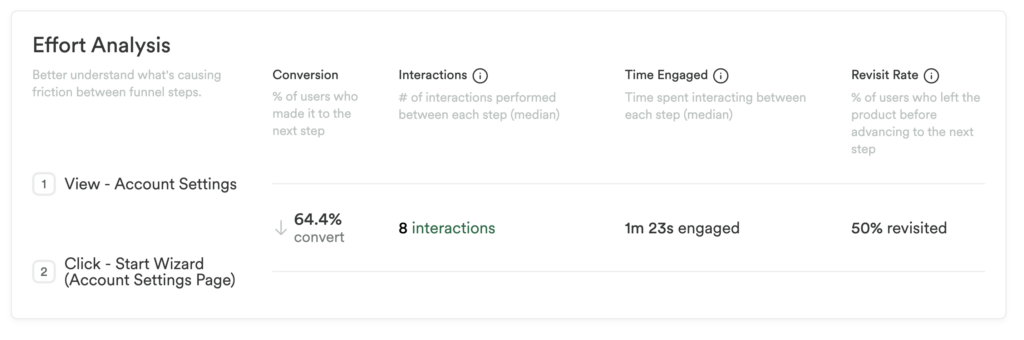
The three signals are calculated as follows:
- Interactions: Total count of clicks, form changes, and form submissions between steps (including interactions you haven’t defined yet).
- Time engaged: Time to convert from one step to the next, but only counting “engaged” time (when there’s at least one interaction within 60 seconds) and ignoring time spent away from the computer (e.g. stepping away for an hour).
- Revisit rate: The percentage of users who had to revisit your workflow across multiple sessions to convert to the next step.
Effort analysis does not appear on funnel charts which have a comparison date range applied.
Note that time engaged differs from standard “wall clock time” measured in other tools. Engaged time counts only time adjacent to a user interaction. For example, if a user is interacting in your app, then goes off to join a meeting for an hour, then returns, engaged time won’t measure the hour in between.
In this example, we see that 76% of users are dropping off before submitting the signup form, and that 8 interactions are taking place between these two steps. This information may prompt us to re-assess the amount of interaction required in our signup form so we can make it easier to complete.
Watching replays of users dropping off and converting
Session replay is an add-on feature for paying customers only. You may try the feature for free for 14 days or 10,000 sessions (whichever comes first), after which you must contact Sales to continue use.
If you have session replay enabled, you have the option of watching replays of users dropping off between each step of your funnel and of users converting at the end of your funnel. Hover over the replay icon and click Replay of users dropping in between funnel steps or Replay of users converting for the last step in your funnel.
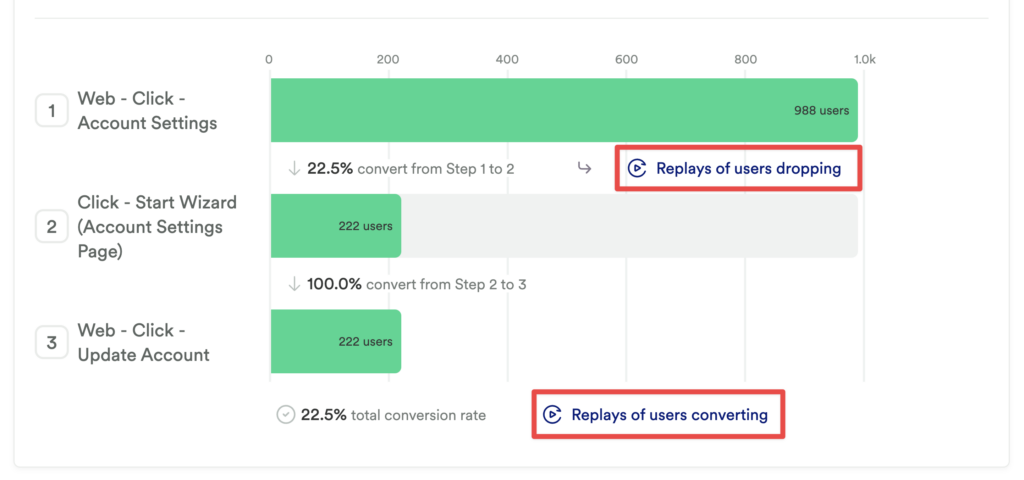
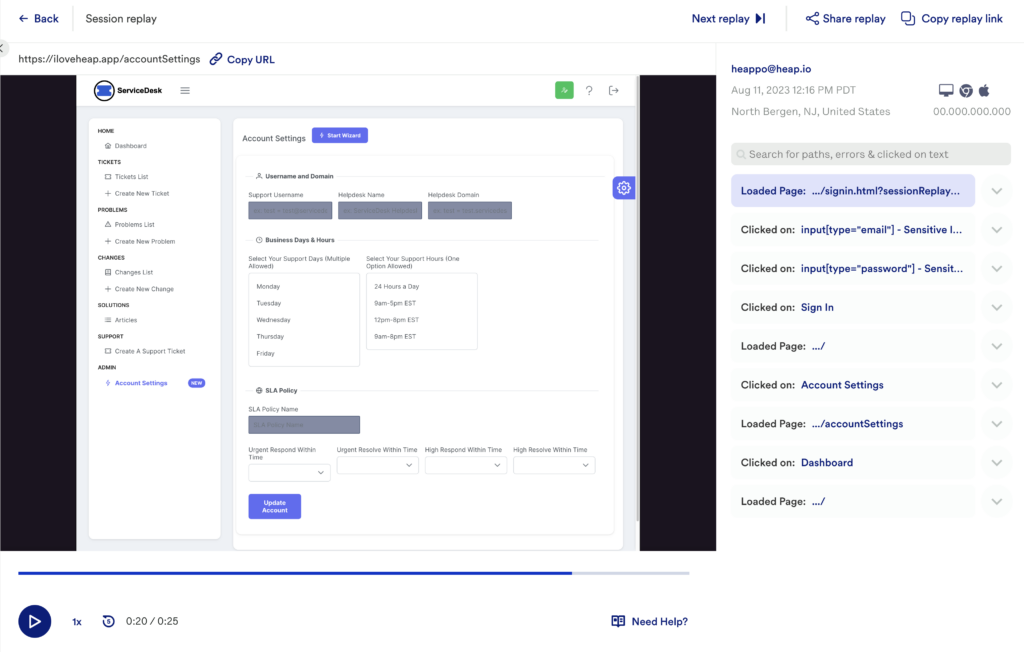
A pop-up will appear where you can watch the latest replay of the event. Use the play, pause, rewind, adjust speed, and next replay options to explore replays where this step in your funnel took place.
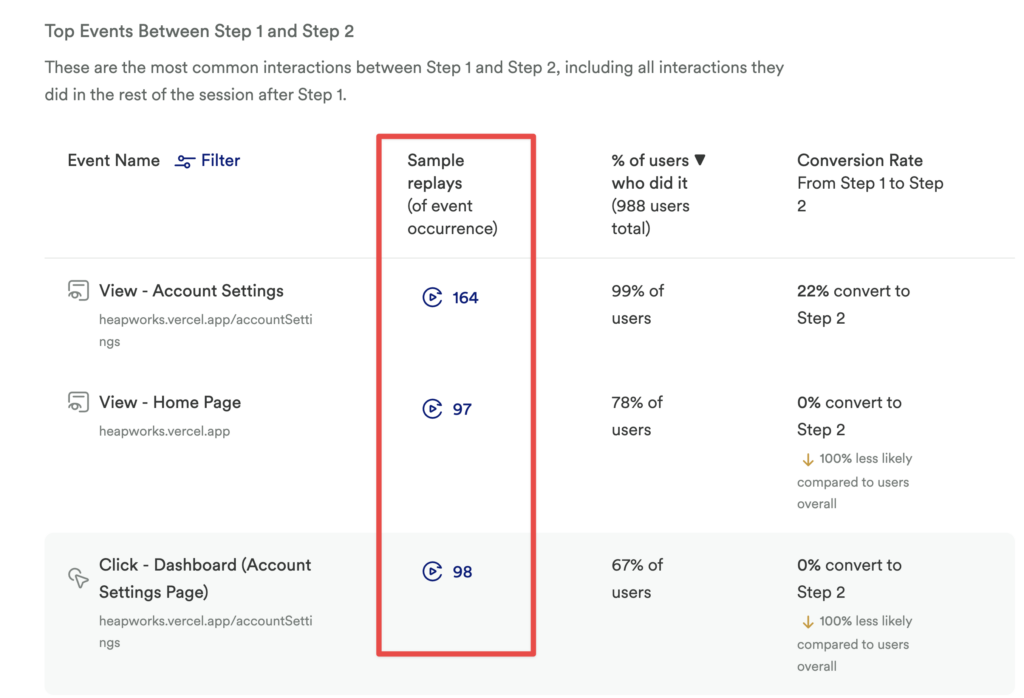
You can also watch replays from the Top Events view. Click on the replay icon in the Sample replays column to watch replays for a given event. You’ll have the option of watching replays of users who drop off or who convert.
Next Steps
The next steps section appears when Heap sees a potential step or group by you can add to your funnel to get even more insights into user behavior. The following types of next steps may appear in this section.
Step Suggestions
Step suggestions may appear if Heap sees a step that nearly all converting users had to complete, but where a significant number of users drop off before and after (for example, a broken but required field in a multi-step form). You can use this info to investigate and devise a plan of action to improve conversion.
These appear under Next Steps next to your funnel results.
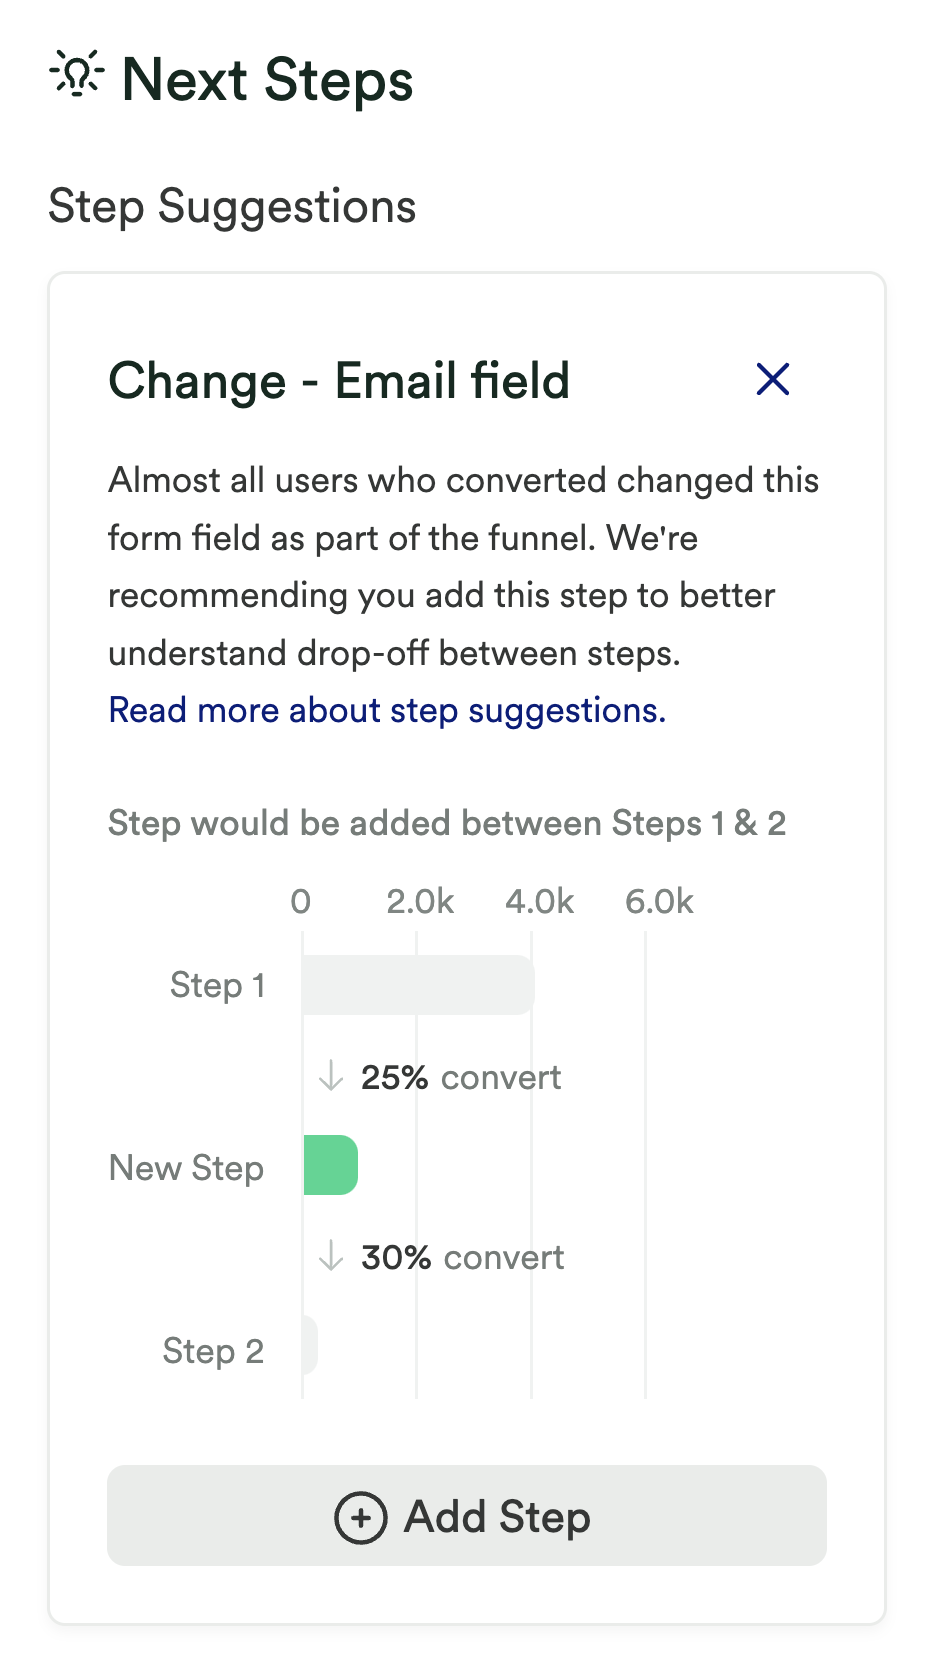
After you click Add Step, the funnel will update to show the newly inserted step as a pageview or change event with an event-level filter.
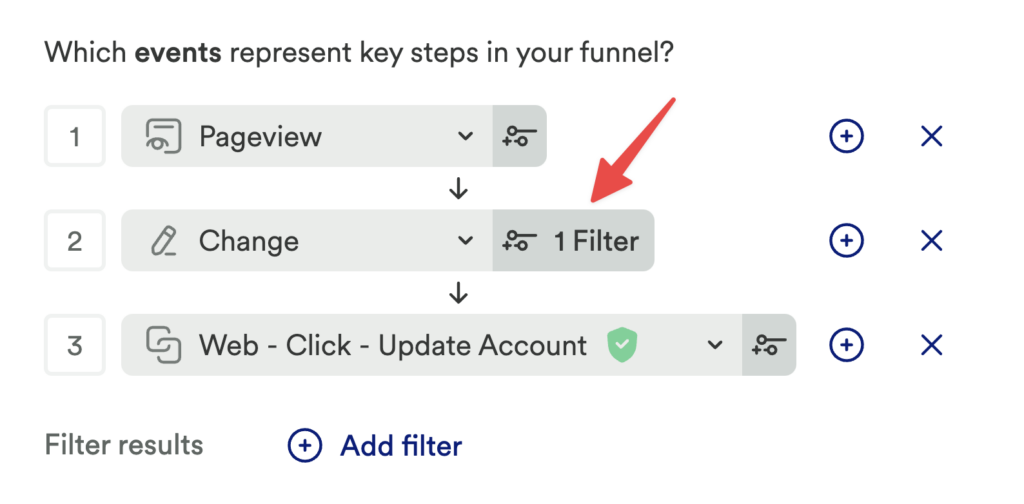
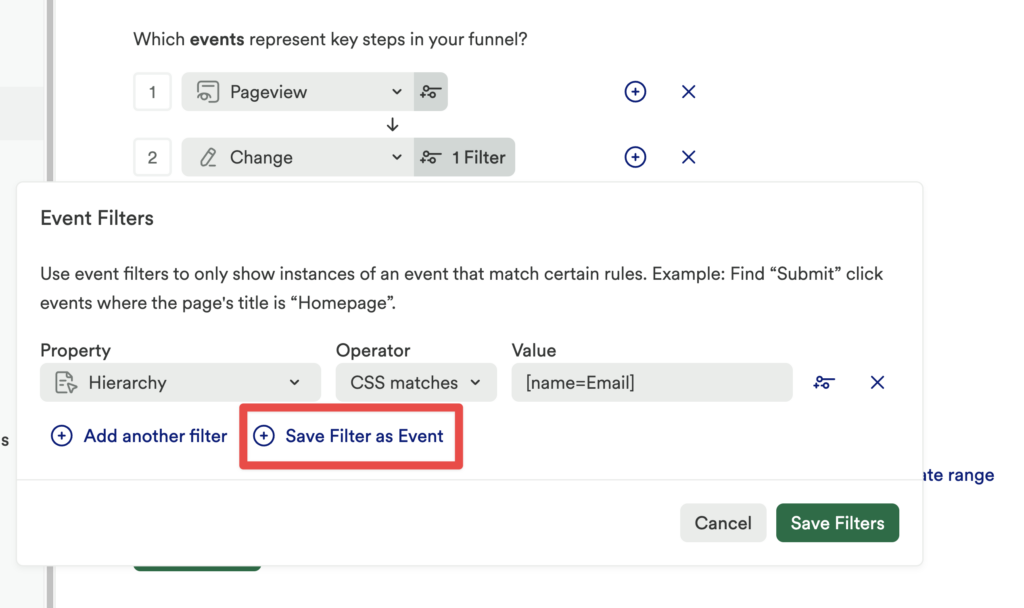
Clicking Filter opens a popup where you can label the step as a new event by clicking Save filter as Event. You can also add edit the filter or add another filter from this popup.
Step suggestions do not include mobile pageviews.
Note that step suggestions will not appear if the funnel has:
- Less than 1 or 10+ funnel steps
- A comparison period
- A group-by
- A date range of more than 7 days
What types of steps are suggested, and how are they calculated?
We suggest two types of steps: Pageviews and Change events.
- Pageview is calculated based on path, such as “View – /store/shoppingcart”.
- Change is calculated based on the name of the form input, such as “Change – firstname” or “Change – zipcode”.
Group Suggestions
Group suggestions automatically suggests groupings for a funnel chart by proactively analyzing which groupings are most predictive of overall conversion rate. This automates the “guess and check” work of trying different groupings when drilling into the reasons for dropoff in a funnel.
Depending on how your chart is set up, the current properties that may be suggested are:
- Country
- Device Type
- Domain
- Hash
- Landing Page
- Path
- Referrer
- Title
- UTM Source
- UTM Campaign
- UTM Content
- UTM Medium
- UTM Source
If you don’t see group suggestions appear in your chart, it is because the type of chart you set up isn’t one that would prompt the suggestion to group by one of these properties. The suggested properties listed are ordered left-to-right based on how strongly they’re related to the events in your chart.
These will appear under Next Steps next to your funnel. You can select one of these to further explore your analysis results.
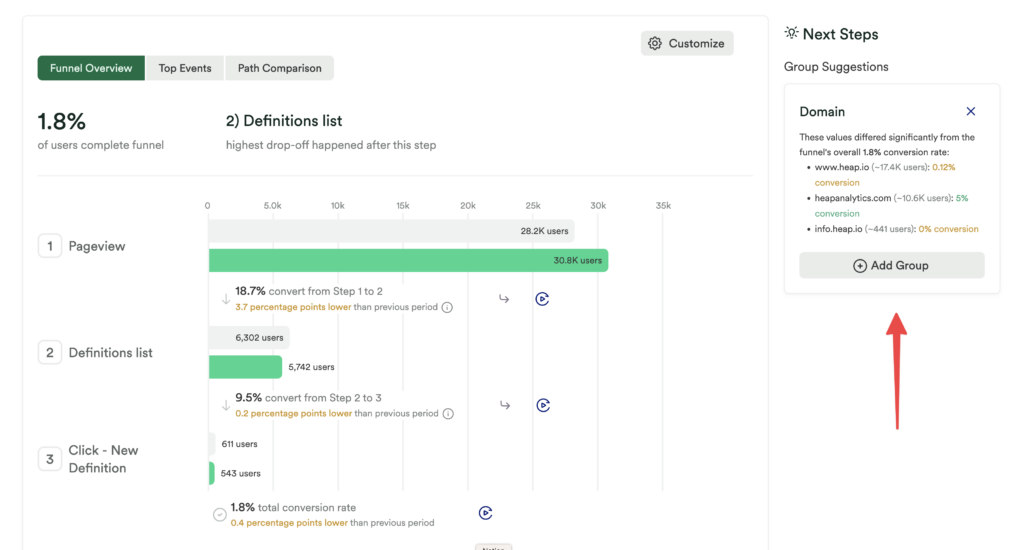
The Suggestion provides a preview of the results of the grouping to help you decide if the results will be relevant for your analysis.
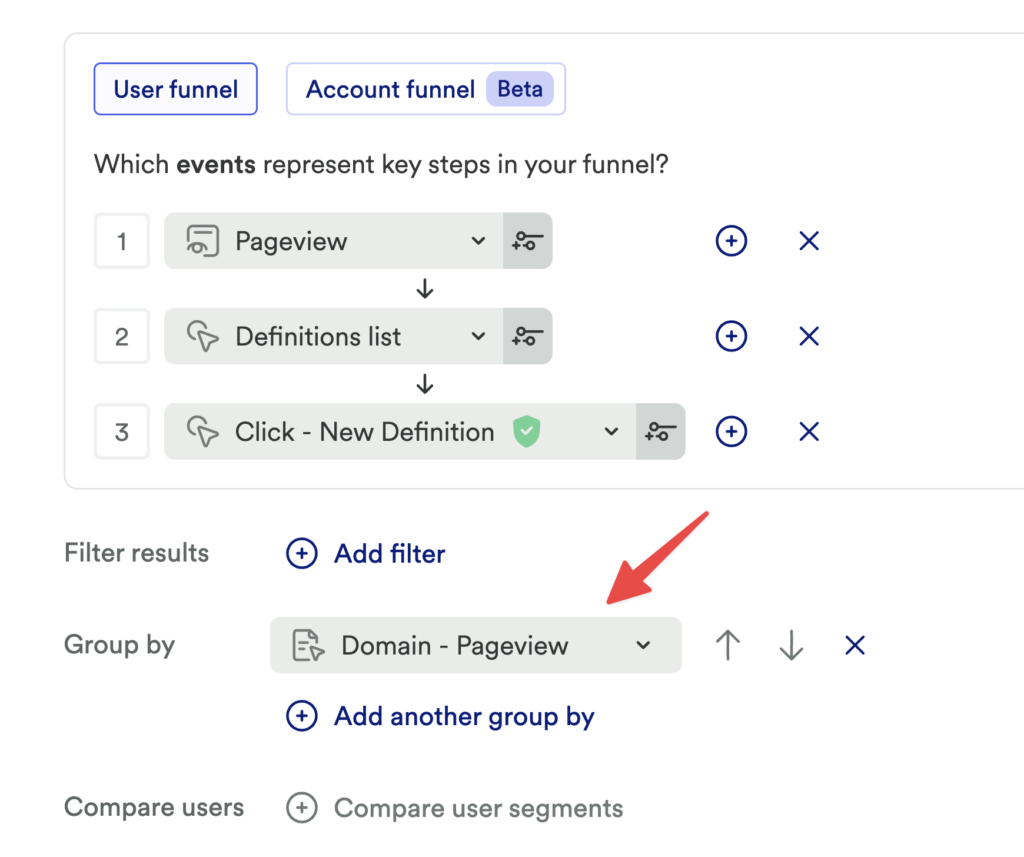
After you click Add Group, it will be added to your chart.
Note that group suggestions will not appear if the funnel has:
- Less than 30 users at the top of the funnel
- A compare by
To learn more about how group bys work in Heap, see Group By.
Hidden Paths
Heap may suggest a Hidden Path, which is an alternate path that users took that skipped a certain step in your funnel.
Under Next Steps, click the View Hidden Path button to jump to a Journeys chart that removes the suggested step from the funnel and makes it an optional step.
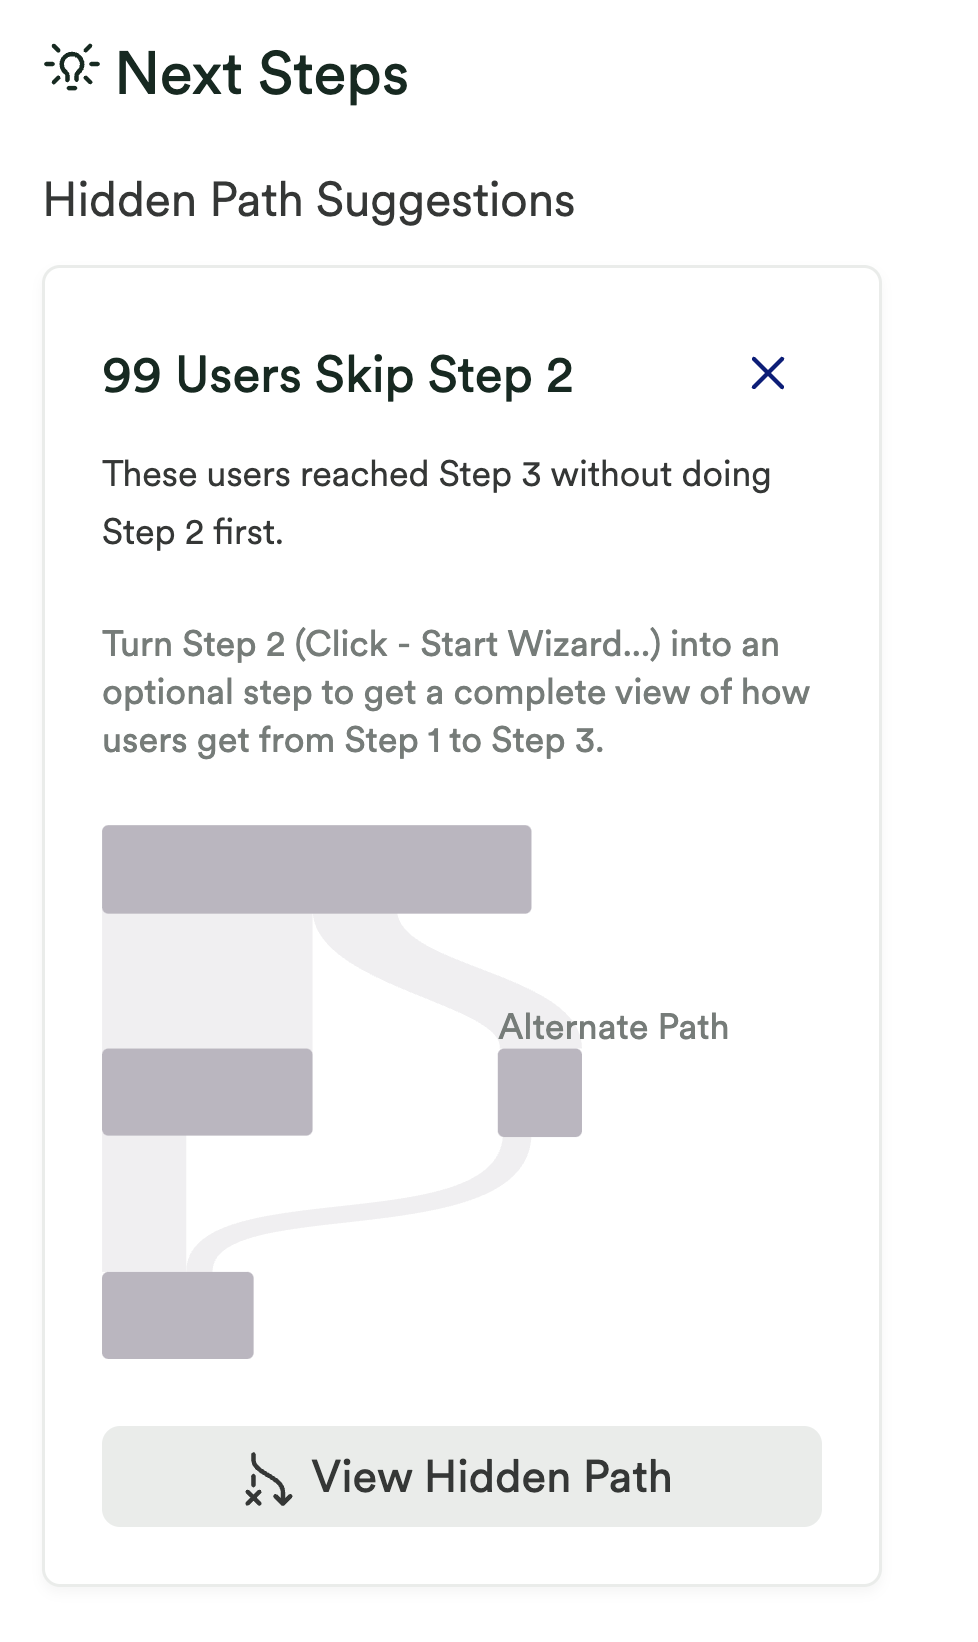
This allows you to see how many users are skipping this step and the comparison rate between users who take the step versus skip the step.
Note that Hidden Path suggestions will only appear when:
- The origin and destination steps are different events
- At least 10 users would have reached the destination step, but don’t show up as converting in the funnel because of the intermediate (“skippable”) step
- Users who skip the intermediate “skippable” step make up at least 20% of the users who would have reached the destination step without that intermediate step
Compare To
You can also add a comparison window to your funnel, such as comparing the past 7 days to the week before, to track changes in conversion between the current period of time and a time period in the past. Referring back to the previous example, if we add a comparison for the past 7 days, our results update to look like this.
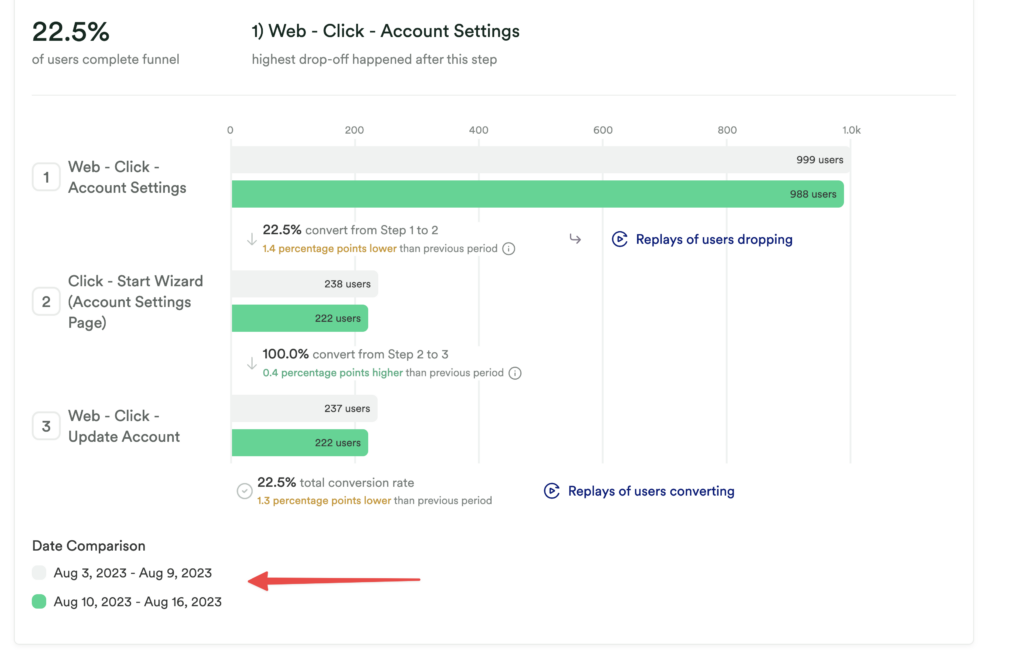
The lighter-colored bars show the results for the previous 7 days. The numbers below the conversion rate show the change in pp (percentage points) between these two periods.
Note that the Effort Analysis section in your funnel chart will not update if you add a compare to.
Conversion Windows
By default, Heap shows you the conversion rate over the entire date range chosen. You can use the date range drop-down to get more refined results.

For example, we can see how many people convert within 10 seconds of hitting the Signup page.
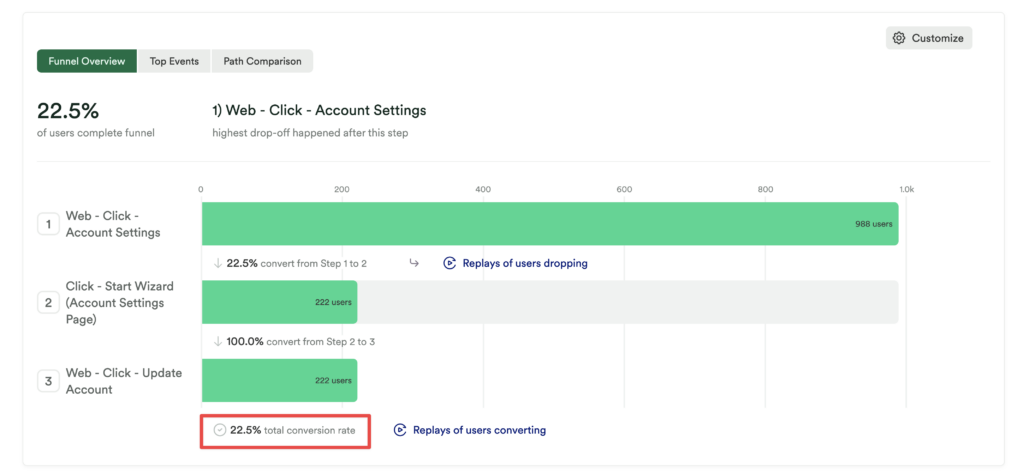
As you see in the results, about 22.5% of conversions happen within 10 seconds.
You can also choose a custom conversion window, which can be any number of seconds, minutes, hours, days, weeks. This is ideal for setting a conversion window that aligns with your goal, such as getting users to complete an action within 2 weeks.
To set a custom conversion window, from the granularity drop-down, select a custom range. Additional drop-downs will appear where you can set the custom conversion window.
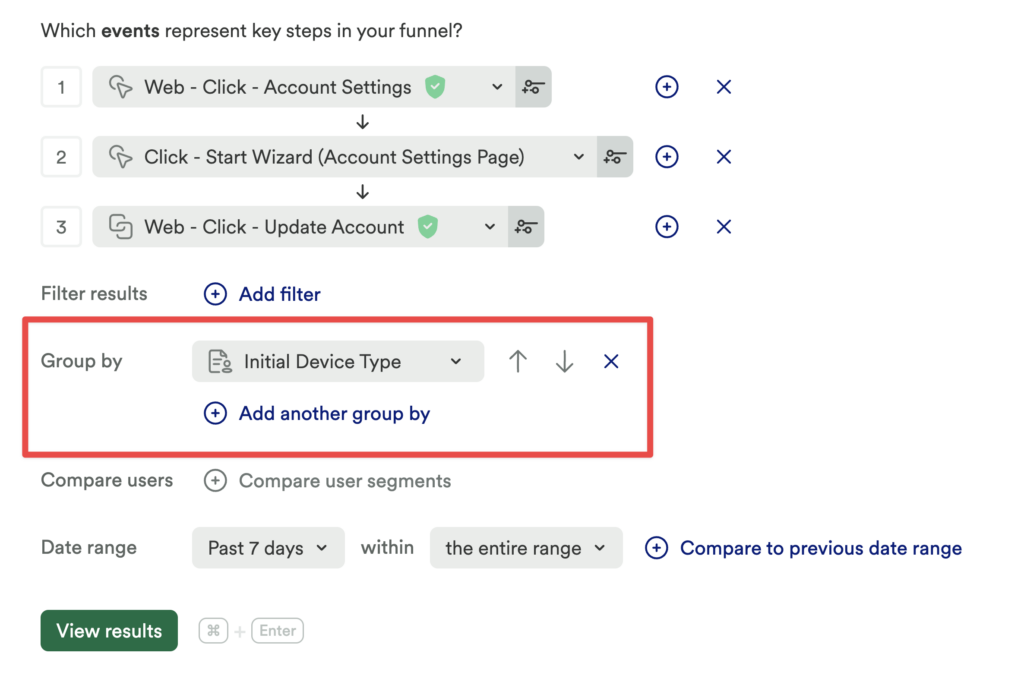
Group By
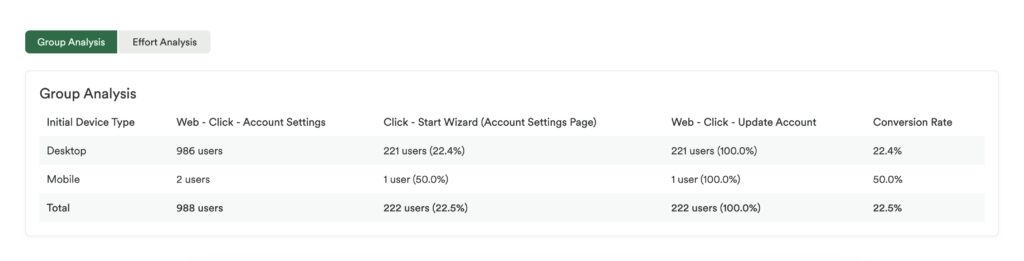
To dig deeper into what is causing the dropoff between step one and step two, you can add a group by clause to group conversion rates by properties such as geolocation, UTM campaign codes, referrer, and more. Check out how this funnel conversion rate changes depending on the user’s Initial Device Type:
You can only group by a single event-level property.
We now see a Group Analysis table below the bar chart showing device-specific conversion rates. In this case, users don’t appear to be submitting signup via mobile, indicating that you may want to take a look at the UX of your mobile site.
What if a user is a member of multiple groups?
Funnels in Heap are user-based, which means users are only counted once. If an event-level group by is used, there is the potential that users could be a member of multiple groups.
If a user does the first event multiple times before converting, they’ll be counted in the group that happened most recently before converting. For example, say we have funnel looking at the conversion from any marketing pageview to signup and we’re grouping by the marketing page title. If a user viewed the homepage, then viewed the pricing page, and then signed up, they’d be counted in the pricing page group, as this group happened most recently before converting to the next step of the funnel.
If it is possible for users to do the sequence of events in the funnel multiple times, users will be counted in the group that happened most recently before the first time they converted within the date range. If a user hasn’t converted, they’ll be counted in the group that happened most recently.
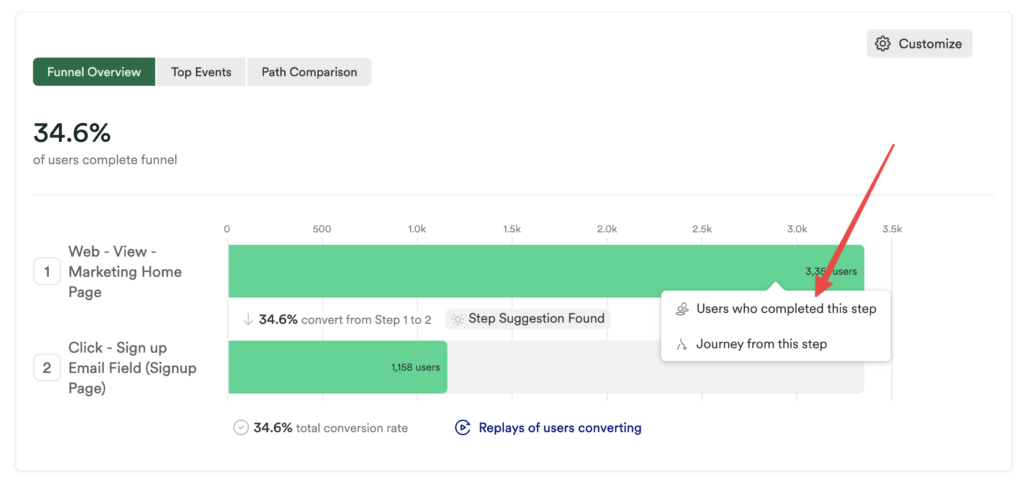
Drill Down
For any of the examples above, you can click on the bars to drill down to the users who have done that event, then click through to a prefiltered chart for that funnel in the Journeys or Users chart. This is helpful for analyzing what users did instead of converting via this step.
Heap funnels become even more powerful when you use our Custom Identify API and group funnels by custom user-level properties tailored for your use case.
Event-level Filters
Event-level filters allow you to filter specific events in your funnel by one or more event-level properties. You can use them to analyze users based on whether they:
- Participated in an experiment variant
- Started an in-app guide
- Viewed an email campaign
This prevents you from having to create one-off events for each property value, such as for each A/B experiment, guide, or email campaign. With event-level filters, you can create funnels that reference one generic event and filter in-line in the funnel for the property value you care about.
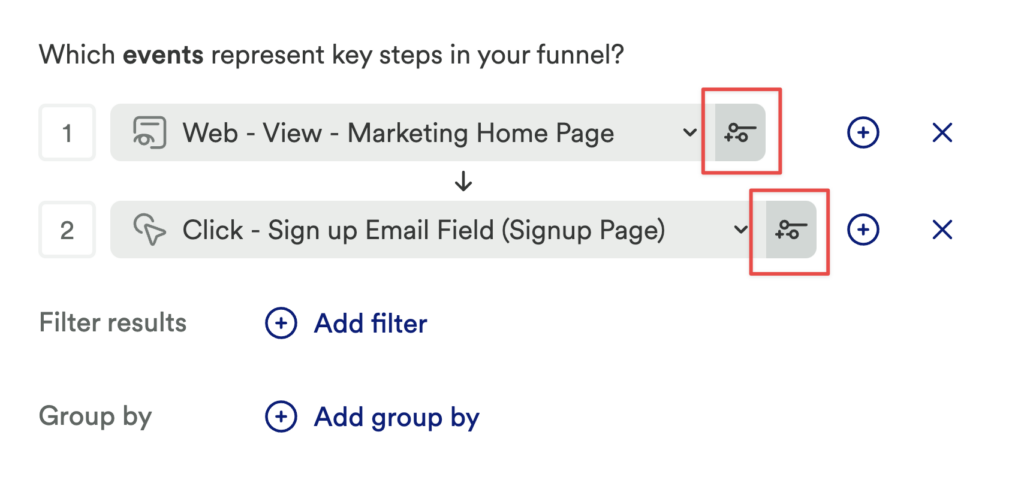
To add the event-level filter, when setting up a funnel, click the subfilter icon next to the funnel step.
Filter for users who participated in an A/B experiment
To get the most out of your A/B testing, see our whitepaper How To Do A/B Testing Right
See our guide Use A/B Testing to improve usage to learn how to use funnels to A/B test.
Filter for users who started an in-app guide
See our dashboard template for Measuring In-app Guides.
Filter for users who viewed an email campaign
See our dashboard template for Measuring your campaign email performance.
Event-level filters and group bys
When running a funnel with a group by applied, you may notice your conversion rate increase after applying an event-level filter. For example, if you are analyzing pageviews grouped by country, and you apply an event-level filter to exclude a certain country, your conversion rate may increase.
This has to do with the way Heap categorizes users who could belong to multiple groups in the group by. Following our example, if one user completed this funnel three times in three different countries (let’s say the USA, Canada, and Mexico) when you run the funnel without the event-level filter excluding one of those three countries, the user will be grouped into the country where they did the event first (let’s say USA).
However, if you apply an event-level filter to exclude users from the USA, then the user will be added to either the Canada or Mexico group, thus increasing the conversion rate.
Period over Period Analysis
You can also use Funnels to conduct Period over Period analysis, which allows you to compare a recent time period to the same time period in the past, such as the same day, week, month or quarter in the past week, month, quarter, or year. For complete steps to set this up, see Period over Period analysis.
Debugging your Funnel
If you are unsure about the steps in your funnel, we recommend using pageviews rather than button clicks or form submissions if possible. The correct pageview event is easy to verify on inspection.
If you are doing form analysis, remember that the steps need to be sequential. If you see an unexpected dropoff, especially if your first step and last step conversion is much higher than the funnel shows for the full form, then your users may not be completing the form in order.
Leaky funnels are another common problem. If you’re seeing unexpected results, consider whether there are other routes that the user may be taking through your funnel that you aren’t capturing in your analysis.
Frequently Asked Questions
For FAQs about this chart type, see our Chart FAQs.