Overview
Filters in Heap allow you to limit the results of your chart to a specific subset based on user-level parameters. Filters allow you to ask questions like:
- How many visitors per day are referred from Facebook?
- How many Australian visitors sign up each week?
To apply filters, add the filter field in any Heap chart. Most filters have three parts, as seen below:

Here’s what they all mean:
The Property represents a user, session, or event-level property that we want to filter on. Examples include referrer, browser, country, or path (the path of a pageview event). A full list of all properties automatically captured by Heap is available in Autocaptured Data.
The Operator represents how we want to match up the Property and the Value. For example, if we say ‘Country’ (Property) ‘equals’ (Operator) ‘United States’ (Value), then the chart will filter out all countries other than the United States. A full list of all operator options and what they mean is provided later in this doc.
The Value represents a text string or numerical value we want to match against.
As an example, if we wanted to know how many times our user profile pages are being viewed, we might use the filter shown below. The ‘wildcard matches’ operator means that the asterisk symbol can stand in for any text string. So the /user/*/profile path can stand in for paths like /user/123/profile or ‘/user/bob123/profile’.

Note: The wildcard character isn’t case-sensitive, and doesn’t work with contains filters.
You can combine filters with AND and OR by clicking the subfilter button, or even specify sub-filters by clicking the + button that shows up to the right of each filter clause. Here’s how we can generate a chart of pageviews on your login or welcome pages:

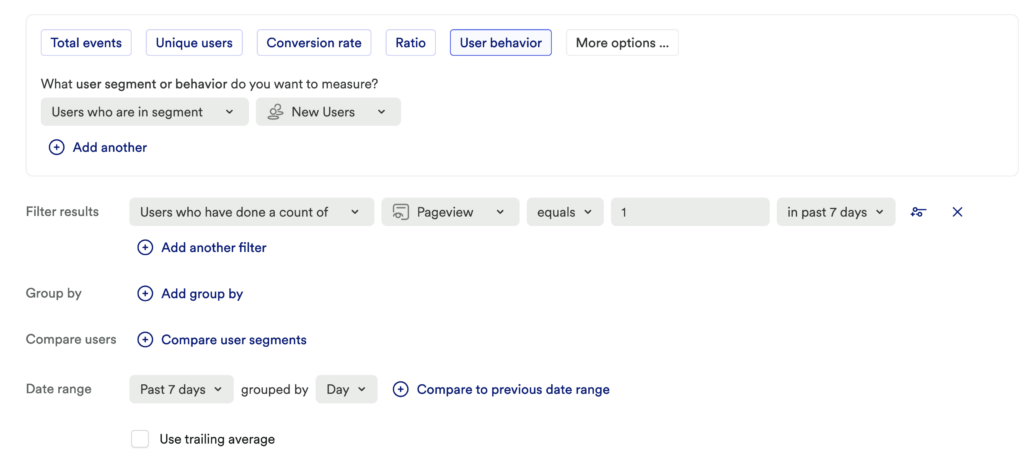
The best part of Heap’s filters is the ability to include aggregated values in filters, not just event properties. To better understand why users bounce from your landing page, you may want to view users who have visited exactly one page and never returned. We can run:

The ability to include aggregations in filters opens up some exciting possibilities.
Property filters
You can set up your filter based on the following types of properties:
Users who are / are not in segment: You can organize your users into segments, like frequent buyers, Canadian visitors, Android beta testers, and more, and filter for behavior by those users.
Behavioral properties: You can use them to add granularity to your chart to see only the results relevant to your question, such as users who have done something or results by a certain metric. Learn more in our Behavioral Properties guide.
Active usage properties: These can be used as part of Active Usage Analysis to filter user activity by type of engagement.
User properties: Filter by any built-in, defined, or custom user property, such as referrer, city, device type, and more. For a full overview of all types of properties, see our Properties overview.
Account properties: Filter by accounts that meet certain criteria, such as a minimum or maximum amount of users, to measure account engagement. For more guidance, see Account Health Analysis.
Operator filters
After / Before
The after and before operators are primarily for use with timestamped properties, such as Date first seen. You can also add ISO8601 timestamps to custom user or event properties and use these operators to filter those as well.
Equals / does not equal
The equals operator includes events and users where the property value equals exactly the filter value, including spaces and capitalization.
Less than / greater than
The less than/greater than operator will provide only values that are less or greater to the value. It defaults to numerical sorting if the property value is a number, and uses lexical sorting if the property value is a string.
Contains / does not contain
The contains filter is not case-sensitive. All values that contain the filter value provided will be included in the results.
Is defined / is not defined
The defined / Is not defined operator will include all events or users where the property value exists or does not exist, respectively.
Wildcard matches / wildcard doesn’t match
The wildcard matches operator allows you to use an asterisk (*) to match a wider variety of results. It’s case-sensitive.
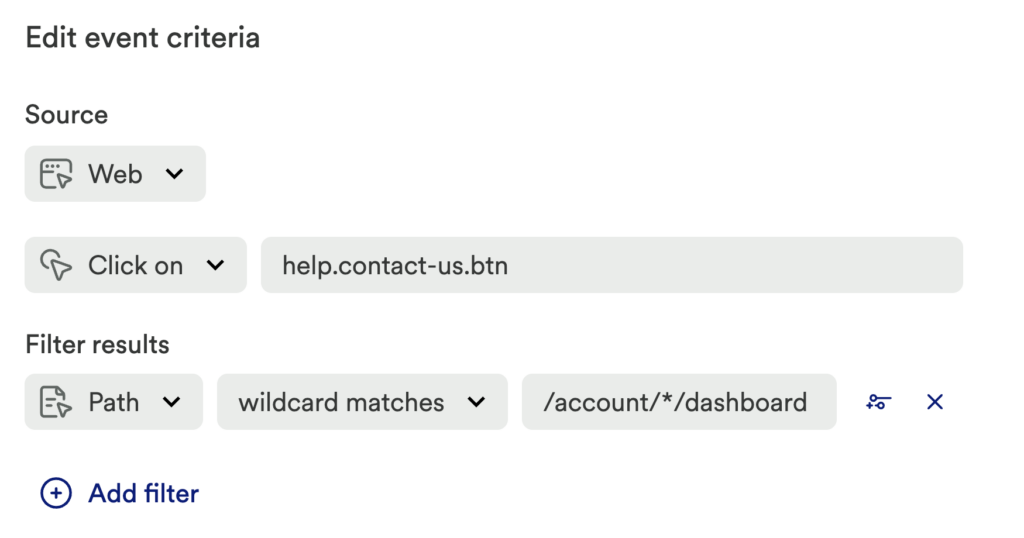
For example, in an event definition, you can use a wildcard match to limit the path to any dashboard page by replacing the number with an asterisk.

Included in file / not included in file
The included in operator allows you to upload a text file (.txt) up to 100 KB in size to filter your results. You can easily create a .txt file to upload in any built-in text editor, like NotePad or TextEdit.
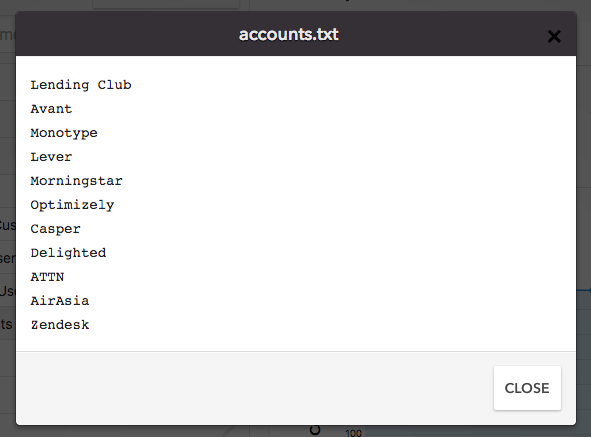
For example, if you would like to create a segment of your accounts, rather than add a filter for each company name, add your accounts to a text file (with a separate value on each new line) and upload them! Heap will filter for events or users that match these property values (this requires an exact match).

To view the values included in the filter, click on the file name.

AND/OR
In addition to subfilters, you may notice that if you add more than one condition, you have and AND or OR between the conditions (you can toggle it to one or the other).

The logic of these work as follows:
• When you are comparing conditions with an OR, the presence of one TRUE condition renders the entire condition TRUE.
• When you are comparing conditions with an AND, the presence of one FALSE condition renders the entire condition FALSE.
For details on how this works, you can read up on Truth Tables, specifically Logical Conjunction (AND) and Logical Conjunction (OR)).
CSS matches
This filter only appears if you have a click, change, or submit event selected, and are filtering by the Hierarchy property. It allows you to define the CSS to match within that hierarchy.

Event-level filters
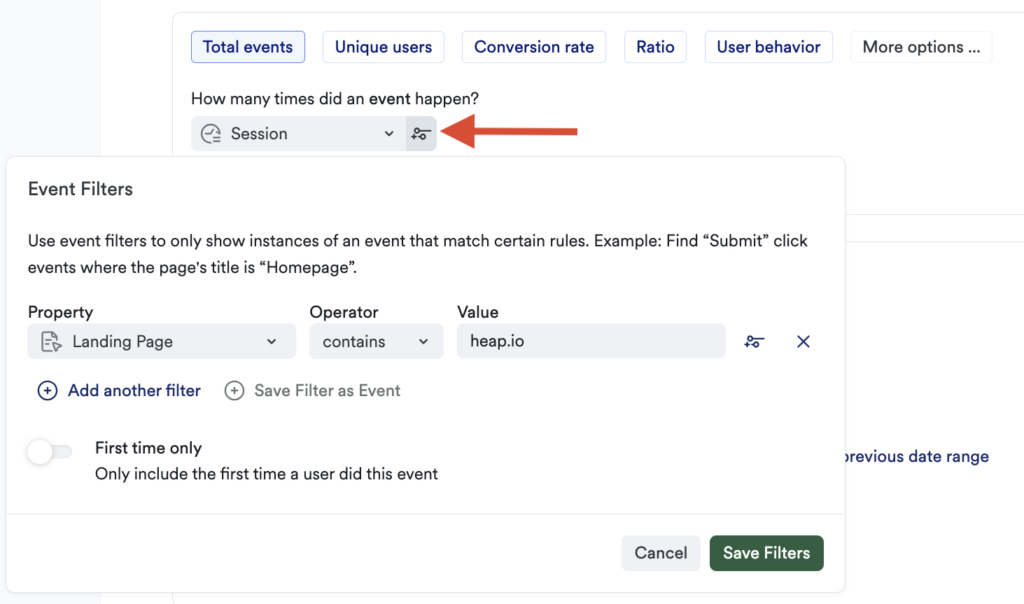
In addition to adding filters to the entire chart, filters can be added directly to an event.

First time only
This toggle counts the event only if it is the first time a user has ever done the event. This allows you to see how many first-time, or new, users you have for an event in a specific timeframe. First time analysis is available in Usage over time, Funnel, Journey, and Acquisition charts.