It’s important to determine your ongoing support strategy to maintain strong customer partnerships. In addition to reactively troubleshooting issues as they arise, proactively guiding customers by offering events, educational resources, and monitoring long-term retention are all important to providing the best customer experience.
Plan Webinars and Customer Events around Relevant topics
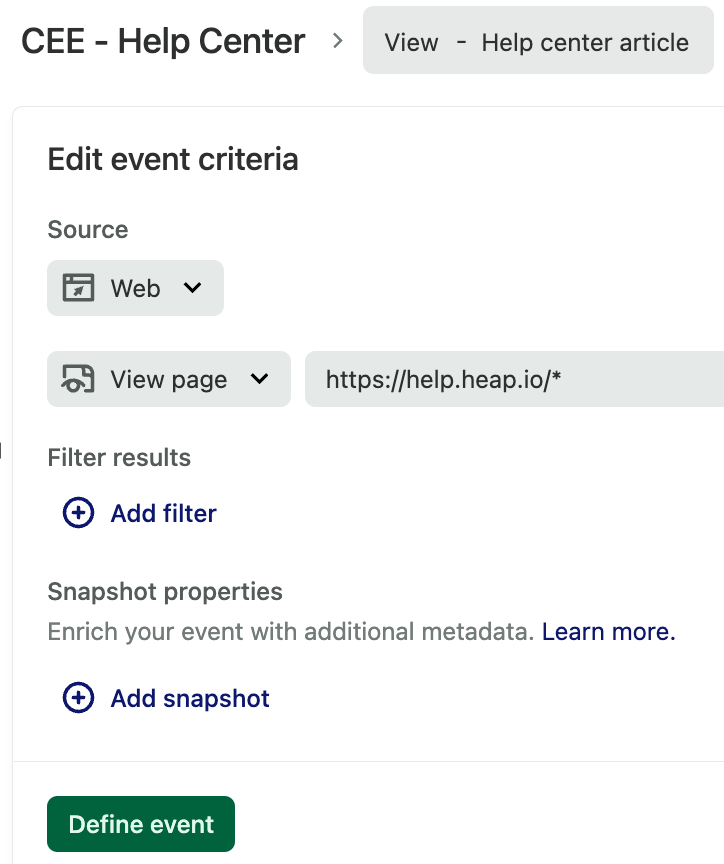
In addition to KPIs, other valuable metrics include the number of customers looking at your customer resources, such as support docs, or clicking a help button. You can even view the most popular documents viewed. In the example below, we will define an event called Viewed Documentation. If you haven’t made your own event yet, follow the steps below:
1. Navigate to Data > Labeled events, click the Label event or property button, then select Event
2. Name your event something like View – Help Center article and select Type: View page
3. Type the URL to your documentation in the text field followed by an asterisk. An example of the URL could be /docs/, /documentation/, or /guides/* depending on how your URL is formatted.

From here, you can set up a Usage over time chart to analyze this event. When constructing the usage over time chart, group by path or title. Depending on your site’s structure, this will give you a breakdown of the most popular documentation pages. From here, you can plan webinars and customer events revolving around topics your customers care about.
Improve Education by Understanding When Customers Contact Support
Another signal that you should provide a training, webinar, or in-app tooltip to guide customers is checking when your customers are reaching out to your support team. For help defining your ‘Contact Support’ event, see our Events guide. If you use a chat program like Olark or Zopim, contact us via the Get support page to help set up manual tracking for these events.
Once you’ve set up this event, you can group by path or page title to see what pages customers are on when they reach out. When changed to a table view, you can see the most popular pages customers click help from.
It is also useful to chart how the volume of in-app support requests changes over time. Does the volume increase around product releases or downtime? Is there something you should be doing to educate your customers in lieu of these trends to eliminate support inquiries?
Measure the Relationship between Support Outreach and Retention
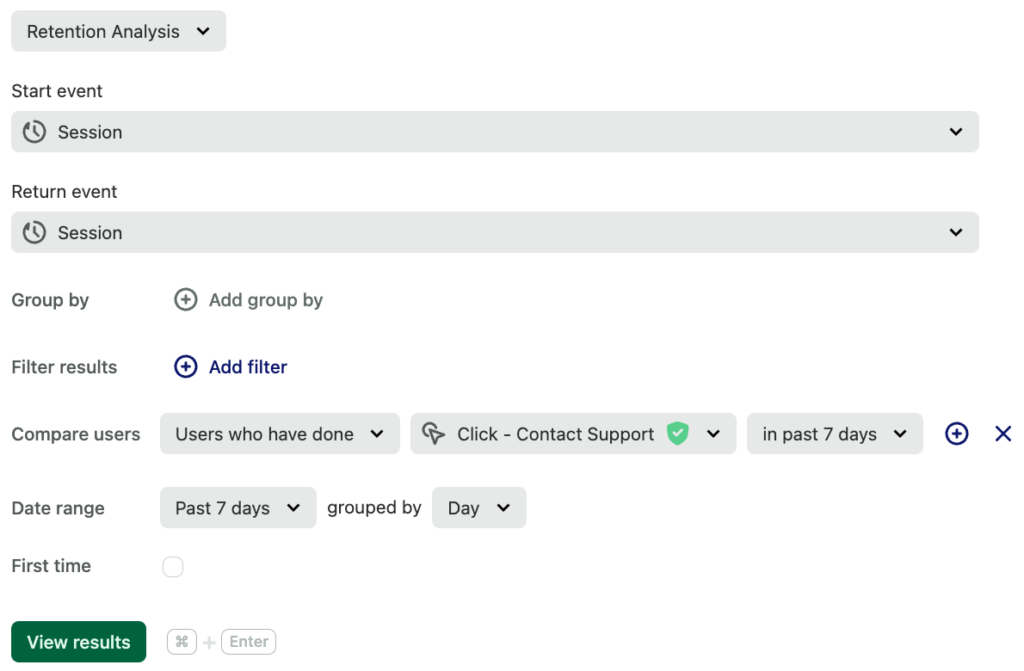
In Heap’s retention tool, you can select a start event and a return event. In this example, we’ll use session to session to measure whether or not customers are coming back, though you can modify this from KPI to KPI as well. Once you have selected event 1 and event 2, group by Has Done Contact Support – this will divide customers into two groups, those who have contacted support and those who haven’t, and you’ll be able to see whether contacting support has a significant positive correlation on retention.

You can also group by Count of Contact Support to analyze the relationship between the number of times someone has clicked ‘Contact Support’ and the percentage of customers retained.
This logic applies to Heap’s funnel and usage over time charts as well. You can analyze if contacting support increases the number of customers who successfully complete your product flow, interact with a certain feature, or end up converting.