If you are interested in learning more about your power users, it may help to create a Power User Curve.
Let’s say you want to see if you have power users who have come back to your product every day for the past week. In the example below, the chart will show a distribution of users who are active weekly across seven days (percent of users who use one day a week, percent who use two days a week, etc.).
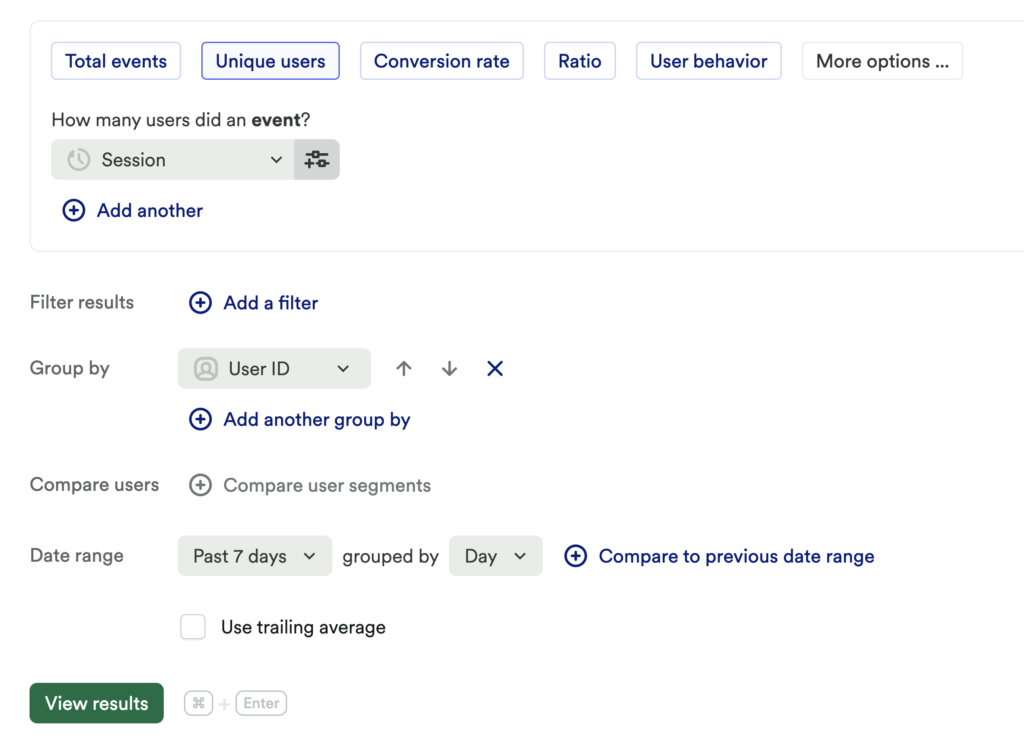
Create a Unique users chart using the following criteria:
- Count unique by session lets us see whether a user did at least one session.
- Group by user ID lets us break this out per user.
- Date range can be varied depending on the period you want to look at, but grouping by day lets us view whether each user did at least one session per day of the range.
Exporting your results to a CSV will allow you to do some basic calculations about your power users. To find the percentage of users who did at least one session per day, divide the number of users with a value of seven by the total number of users. A value of six would indicate that the user did at least one session in six out of seven days, and so on.
You can download a CSV of your results by going to the Actions menu and clicking Export result to CSV.