Overview
A/B testing is essential to validating that changes to your product will help you achieve your business goals. In this guide, we’ll walk through the following examples using Heap for A/B testing:
Example 1: Increase Feature Usage
Your product team is trying to increase the usage of a particular feature. You use an A/B test to try out two different placements of the button that activates that feature to see which one results in increased engagement.
Example 2: Testing Homepage Taglines
Your marketing team is trying to choose between two different taglines for your homepage to see which results in increased trial signups. For your A/B test, you may try out one homepage with tagline A, and another with the tagline B, then compare engagement with these pages.
For an interactive course on how to conduct A/B testing in Heap, check out our Heap Use Cases | A/B Testing Data course in Heap University.
Step 1: Determine goals
Before setting up your A/B test, it’s important to decide on the desired outcome so you can determine what data to capture. Do you want to increase signups, purchases, or use of a key feature? If so, what user activity represents this (clicks on a button, views of a page)? Take a moment to write this down to reference later in the process.
Once you’ve determined what information you need to have in Heap to analyze this experiment, you’re ready to set up Heap or one of our integrations to capture this data.
Step 2: Capture test data
There are several ways you can get your experiment data into Heap:
Integrations
Heap has direct integrations with Optimizely X, Oracle Maxymizer (enterprise plans only) and Visual Website Optimizer (VWO) to get your experiment data into your account.
Specific recommendations for using Optimizely X and VWO to capture user test data and experiment test data are provided below.
Optimizely Classic & Optimizely X Experiments
If you’re running experiments through Optimizely, it’s easy to send over experiment information to Heap using the addUserProperties API. Sending experiment data to Heap can help you see more granular information about conversions and usage.
If you’re using Segment you can skip this entirely, and instead go to your Optimizely integration and check the box next to Send experiment data to other tools (as an identify call).
This example assumes you’ve already installed Optimizely and have started running experiments.
You can use Optimizely’s API to send the names of all the active experiments, along with their variations to Heap. Optimizely stores all the necessary information in the optimizely object, described in more detail below:
Active Experiment IDs
optimizely.activeExperiments is an array with the list of active experiment IDs, it looks like this: ["8675309", "72680"]
Experiment Names
Optimizely provides an object called optimizely.data.experiments which lets you map an experiment ID to more detailed information about the experiment, though all we need to know is that there is also a property called name. For example, using the experiment ID from above, 8675309, we can find out the name for that experiment with optimizely.data.experiments["8675309"].name.
Variation IDs
Each experiment can have a number of variations. Just like experiments, they are referenced by their variation ID, which can be mapped to a variation name. We’re using names for this example because it will make the data easier to understand when it’s in Heap. We can read variation names directly with the experiment IDs from above, though in case you’re curious, the variation IDs are available in optimizely.variationMap.
Variation Names
The names of the experiments and variations are labeled initially by you in the Optimizely dashboard. This example uses the API to read those names. To get the variation name for one of the active experiments, you can use optimizely.variationNamesMap["8675309"]
Bringing it All Together
If you’re using Optimizely Classic, use this code block:
// Create an object to store experiment names and variations
var props = {}

for (idx in optimizely.activeExperiments) {
    props[optimizely.data.experiments[optimizely.activeExperiments[idx]].name] = optimizely.variationNamesMap[optimizely.activeExperiments[idx]];
}

heap.addUserProperties(props)
If you’re using Optimizely X, use this code block:
// Create an object to store experiment names and variations
var props = {}

// This covers both A/B Experiments and Peresonalization
var camState = optimizely.get("state").getCampaignStates({"isActive": true});

    for (x in camState) {
        if(camState.isInCampaignHoldback != true){
            props[camState[x].id] = camState[x].variation.name;
        }

    else {
            props[camState[x].id] = "Campaign Hold Back";
        }
    }
heap.addUserProperties(props);
If we have two experiments running, called Experiment #1 and Experiment #2, and the visitor was in Variation A and Variation B respectively, the resulting props object would look like this:
{“Experiment #1”: “Variation A”, “Experiment #2”: “Variation B”}
Since heap.addUserProperties takes an object as its only parameter, this maps directly.
Visual Website Optimizer (VWO)
Visual Website Optimizer (VWO) is another popular A/B testing platform, and integrating it with Heap works similarly to the example given above. The code below converts VWO experiment data into an object which gets passed to heap.addUserProperties. It assumes you have already installed VWO on your site.
Put this code on every page on which you’re running experiments, after both the VWO snippet and the Heap snippet. For more information, check out VWO’s documentation on Integrating VWO with Heap.
<script>
  (function() {
    window.VWO = window.VWO || [];
    var WAIT_TIME = 100,
      analyticsTimer = 0,
      dataSendingTimer;

    // All tracking variable will be contained in this array/object
    window.v = [];
    window.vwoHeapData = {};
    v.add = function(w, o) {
      vwoHeapData[w] = o;
      v.push({
        w: w,
        o: o
      });
    };
    // Function to send data to Heap
    var sendData = function() {
      window.heap.addUserProperties(vwoHeapData);
    };
    //Function to wait for Heap before sending data
    function waitForAnalyticsVariables() {
      if (window.heap && window.heap.loaded) {
        clearInterval(analyticsTimer);
        sendData();
      } else if (!analyticsTimer) {
        analyticsTimer = setInterval(function() {
          waitForAnalyticsVariables();
        }, WAIT_TIME);
      }
    }
    window.VWO.push(['onVariationApplied', function(data) {
      if (!data) {
        return;
      }
      var expId = data[1],
        variationId = data[2];
      if (expId && variationId && ['VISUAL_AB', 'VISUAL', 'SPLIT_URL'].indexOf(_vwo_exp[expId].type) > -1) {
        v.add('VWO-ExpId-' + expId, _vwo_exp[expId].comb_n[variationId]);
        // Only send if data is available
        if (v.length) {
          clearTimeout(dataSendingTimer);
          // We are using setTimeout so that all experiment can be sent in just one call to Heap
          dataSendingTimer = setTimeout(waitForAnalyticsVariables, WAIT_TIME);
        }
      }
    }]);
  })();
Snapshots
You can use snapshots to add experiment variant information as an event-level property. For example, on page load, a JavaScript snapshot could check for a specific variant ID and return the value as an event-level property.
APIs
If the experiment variant information can’t be captured via snapshots, you can use our client-side addEventProperties API to add the experiment as an event-level property. Essentially, this allows you to send the experiment data into Heap, and append it as an event property for the specified event.
Once the experiment is over, be sure to use clearEventProperties to stop tracking the experiment.
Step 3: Label experiment properties, events and segments
Now that you’ve got your experiment data flowing into Heap, the next step is to prepare it for analysis.
If you conduct a/b tests regularly and are worried about overloading your dataset, you can archive these data labels once your experiment is done. For more information on archiving labeled data, see Dataset Cleanup.
If you have Heap Connect and would like to manage your dataset downstream, we recommend unsyncing the property. This will drop the property column on all relevant tables downstream.
Properties
When analyzing your experiments, you’ll group by the experiment variant, which is captured in a property. You will want to make sure the property captured via the methods in Step 2 are correctly labeled in Heap to use them during analysis.
If you’re using an integration, your property may be automatically assigned an ID, which will automatically be the property name in Heap. If you’re capturing your experiment data via APIs or snapshots, you’ll want to give your property an intuitive name so it doesn’t get lost in your dataset.
To double-check the names of these properties and to make sure they are being correctly captured, navigate to the Data > Properties page. Click the property you want to double-check, and on the property details page, check the top to see how it was captured. For example, snapshot properties will list snapshot.
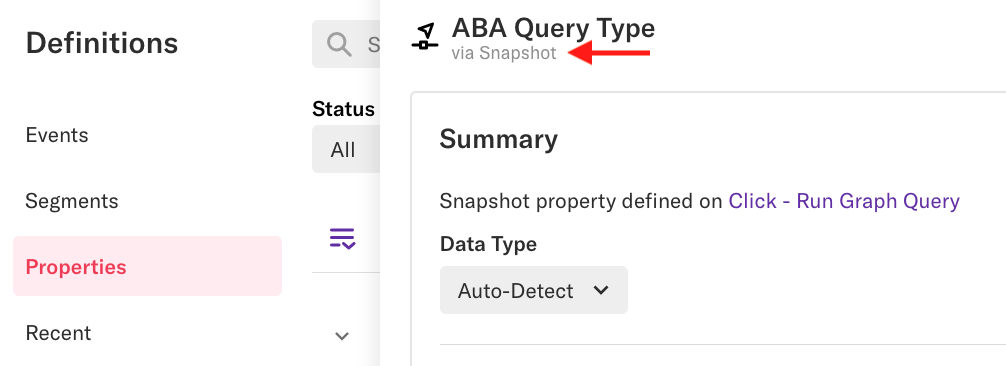
Properties brought in via one of Heap’s APIs will say Custom API.
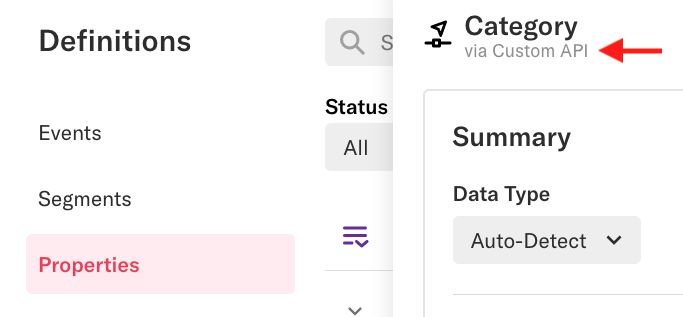
Depending on how you’d use this in analysis, you may wish to create a new property to rename this property. For our examples, we may create the following new properties:
Example 1: Increase Feature Usage
To measure views of a variant of our chart page, we’ll name our property 2021 Q3 Experiment – View Charts Page.
Example 2: Testing Homepage Taglines
To measure views of a variant marketing homepage, we’ll label 2021 Q3 Experiment – View Marketing Homepage.
If you regularly conduct a/b tests, including the time frame of the current test will help you keep your experiment data organized.
For more information on properties, including how to create new properties based on existing properties, see our Properties guide.
Events
Be sure to also have the events that represent the activity you want your users to engage in labeled so you can analyze them. Following our previous examples, you could labeled the following events:
Example 1: Increase Feature Usage
Your Product team may want to use A/B testing to see if updating a feature page increases engagement with that feature. At Heap, we created a Click – View chart event to track usage of that analysis chart.
Example 2: Testing Homepage Taglines
If your Marketing team is conducting an a/b test on a new homepage layout to see if a different tagline results in more trial signups, you may want to create a Homepage – Click – Sign up for 14-day trial event.
You can create new events via the visual labeling or on the Events page in Heap. See our guide to Events for complete steps and best practices when creating events.
Segments
If you want to go further with your analysis, such as seeing the conversion rate between, setting up a multi-metric chart, or conducting retention analysis, you’ll want to create segments based on events for each specific variant. To do this, you’ll first need to set up additional events. Based on our examples, you’d create the following events for each variant:
Example 1: Increase Feature Usage
Click – View chart – A (Q3 2021)
Click – View chart – B (Q3 2021)
Example 2: Testing Homepage Taglines
Homepage – Click – Sign up for 14-day trial – A (Q3 2021)
Homepage – Click – Sign up for 14-day trial – B (Q3 2021)
For steps to create segments, see our Segments guide.
Step 4: Analyze engagement
At this point, you’ve deployed your test across your site or app, collected as much data as you need to see which version performs better, and set up the experiment labels you need for analysis. See each section below for steps to set up these analyses in Heap.
Compare counts of goal event
To see how many users engaged in your goal event, navigate to Analyze > Usage over time, set up a usage over time chart with the count of the goal event, then group by the variant event property.
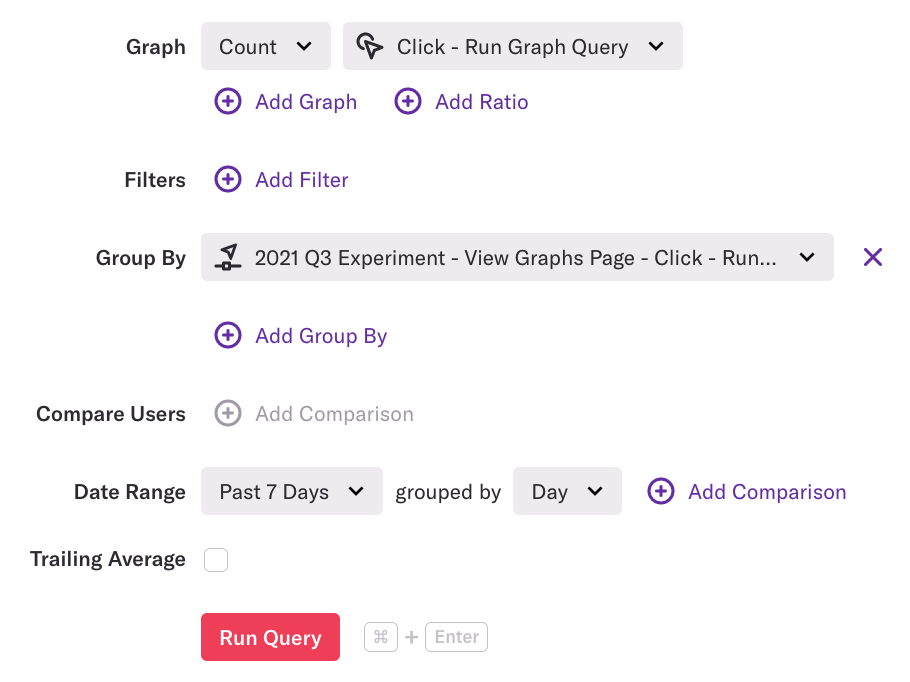
You can also group by a segment, which will enable you to use a multi-metric chart or see conversion rate between.
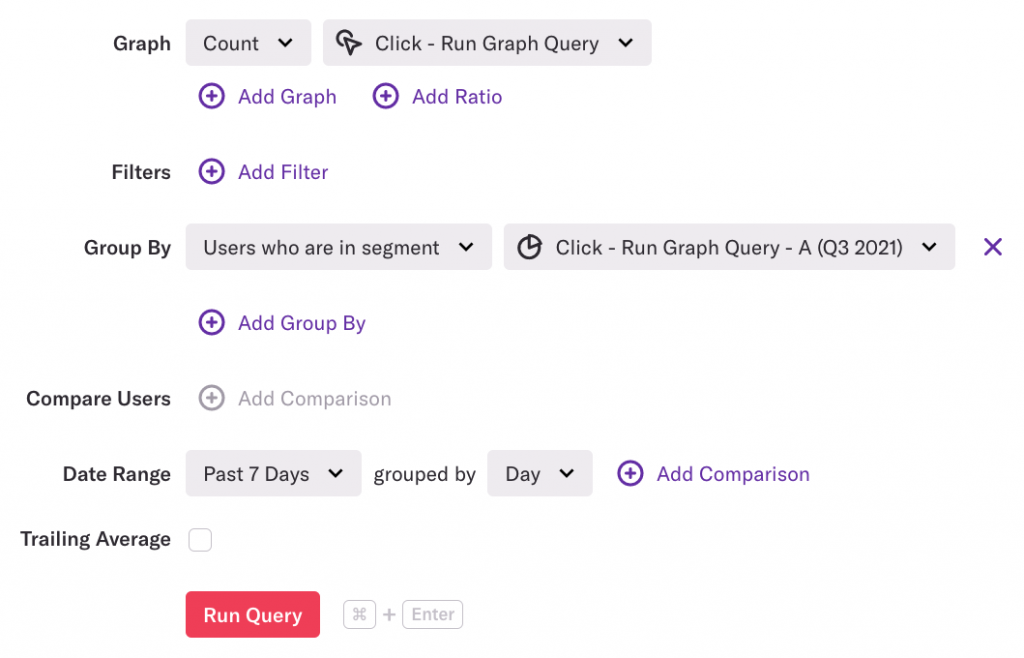
Click the View results button. You can use the results to compare the performance of the group of users who saw the version A of a new usage over time page in comparison to the users who saw the existing usage over time page.
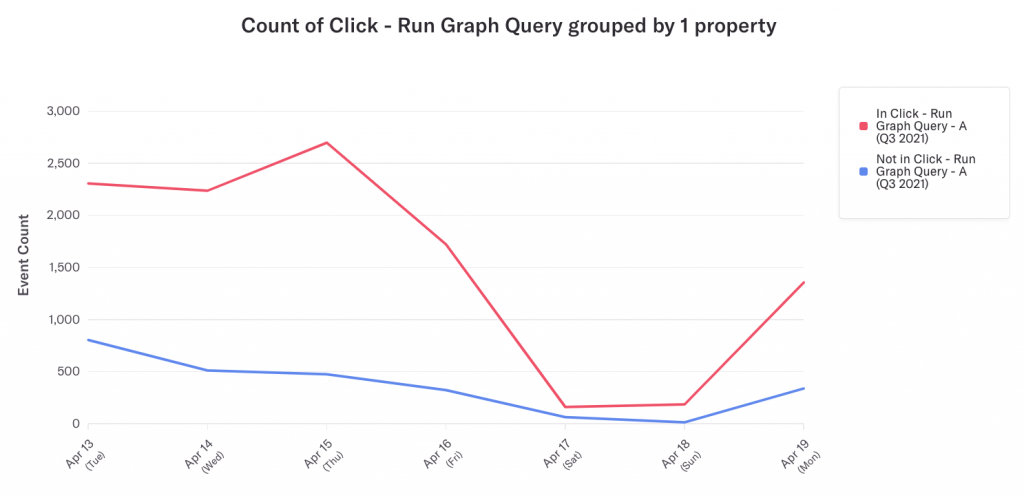
Though A/B testing typically involves comparing only two versions (hence the name), you can easily create and analyze multiple versions of events in Heap. A good use case for this is to compare engagement with the current version of the event as a control variable to make sure these new versions do not decrease engagement.
For additional insights into how users engaged with your a/b test, apply a filter or group by an additional user property to analyze how different types of users engaged with each version.
In our example, we may want to see whether users who don’t use our usage over time chart very often responded better to one version over the other. To see this, we’ll apply a filter to see results for users who have only run queries less than 3 times per month over the past 90 days.

If you are using an A/B testing tool that doesn’t provide statistical significance details, then use the results from this chart and plug it into a statistical significance calculator. These can easily be found with a quick search online.
Compare completions of funnel
Analyzing whether users completed your event as part of a sequence of events gives you insight into the customer journey that many A/B testing tools don’t provide. Our funnels chart allows you to measure the conversion rate for your goal event, which you can use to make an informed decision about which experiment variant to move forward with.
If you are only looking to analyze how one particular variant performed, you can apply event-level filters to existing events. See the Filter for users who participated in an A/B experiment use case in our Funnels guide to learn more.
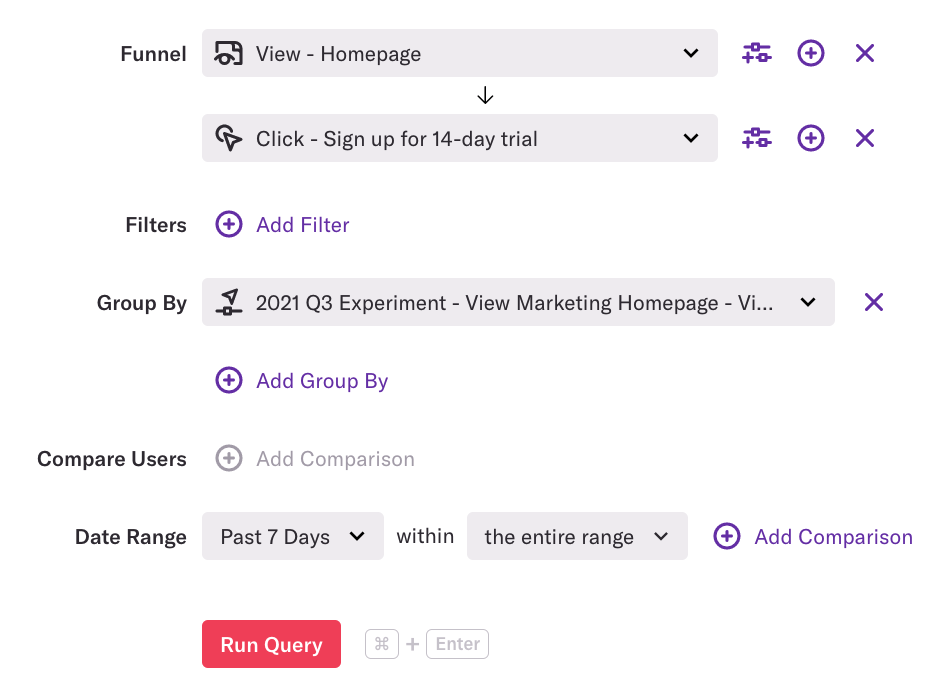
To measure funnel completion, navigate to Analyze > Funnel, set up your funnel steps, then group by your experiment variant property. Make sure that the date range aligns with your experiment.
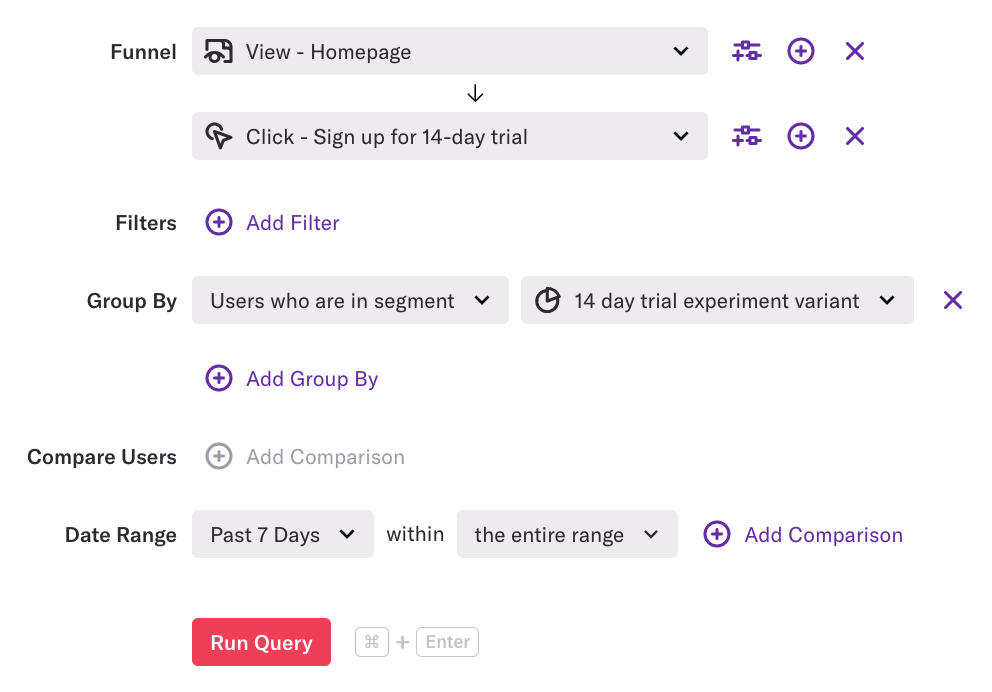
You can also group by a segment which will enable you to see users who are in the segment that corresponds to your experiment. Make sure that the date range aligns with your experiment.
In the results, we see which one is more successful based on whether users in the segment had a higher conversion rate than users not in the segment.
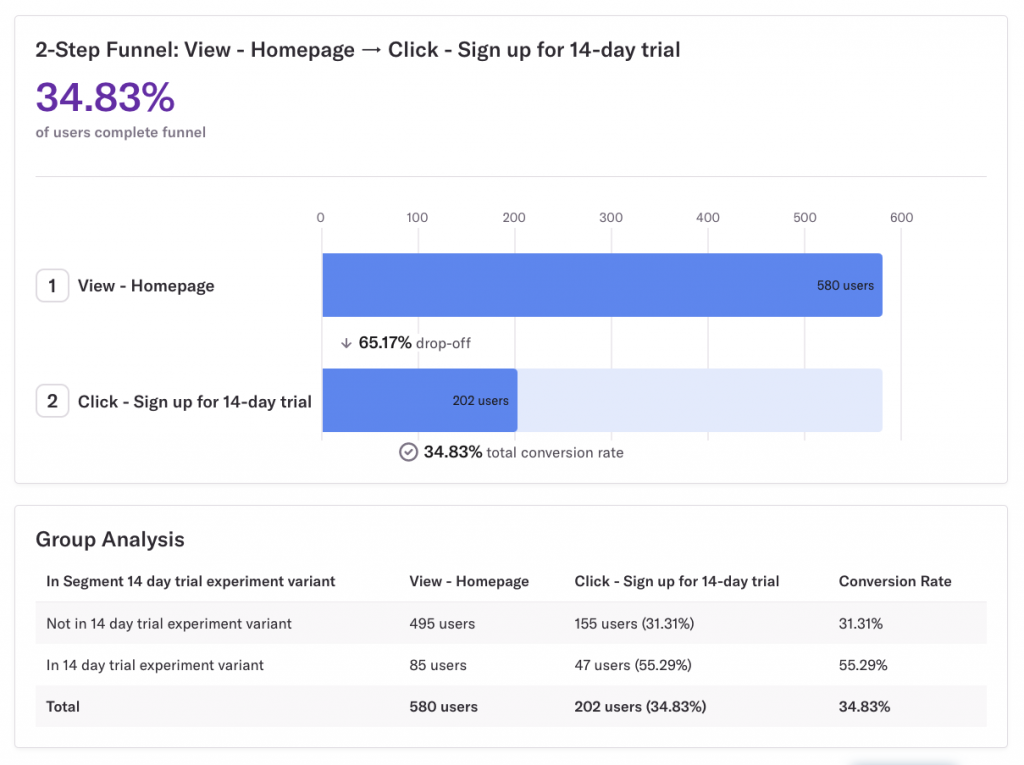
If you’re using an integrated testing tool, it will tell you which option was the winner of the experiment, though it doesn’t show you the full customer journey to see if they completed your intended goal. You can use Heap to see the full journey and if it resulted in a higher conversion rate to make the best decision about which variant to choose.