Overview
You can determine which campaigns are driving the highest conversion rates by labeling the following three events.
Event 1: The Landing Page
Go to Data > Labeled events, click the Label button, then select New event.
On the page that appears, set the event type as View page, then type in the URL of your landing page.

Name your event (we recommend giving it a category like Marketing and an event name View Landing Page) and click the Label event button.
For more information on how Events work, check out our Events guide.
Event 2: Click Signup/Get Started CTA
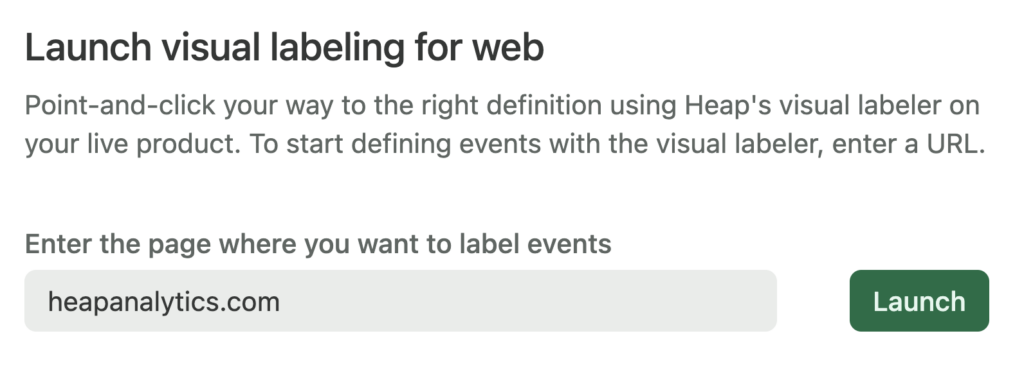
To label this event, navigate to the Visual labeling page, enter the URL of your landing page (or select it from the URLs in the drop-down), then click Launch.

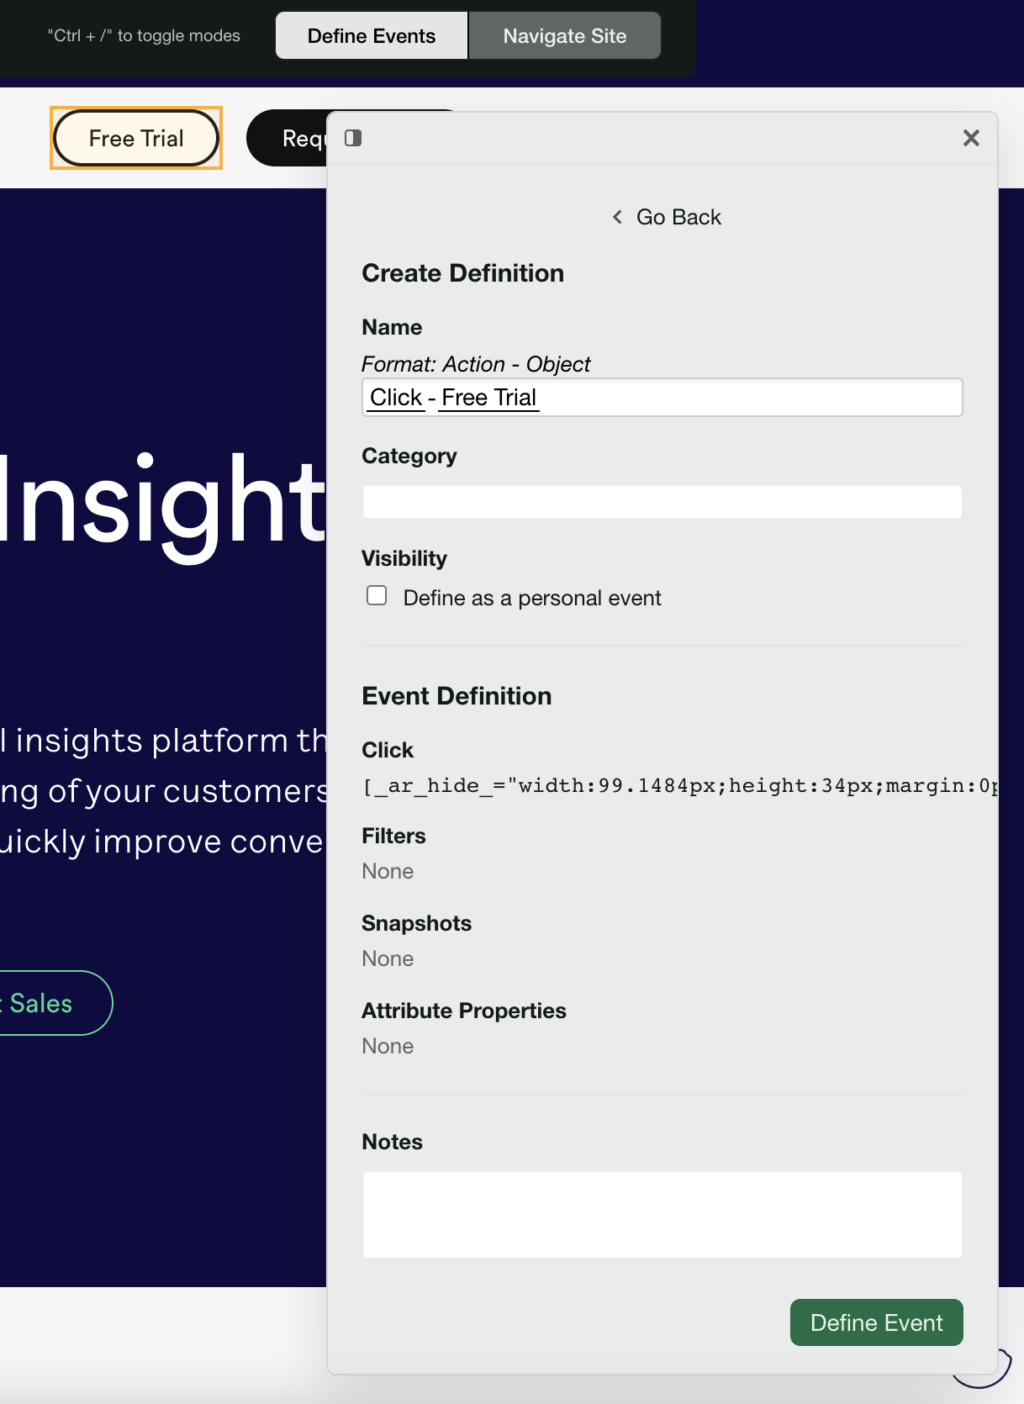
The visual labeling interface will open in a new tab. Click the CTA just as if you were a user, and our event labeling modal will pop up. Give your event a name and click Save.

Event 3: Submit the Signup Form
Navigate to your Signup Form. You might have to switch to Navigate Site in order to get there.

Click the Signup button on your signup page. You may see the entire form highlighted rather than just the button. Don’t worry! This means we are picking up the form submission rather than a click on the signup button.
*If you have a signup page vs. a signup modal, you should also label an event for viewing the signup page.
Analyzing the Data
Now we’re ready to analyze the marketing funnel. Within Heap, navigate to Analyze > Funnel. Select your three (or four events) and click View results to get the drop-off between each step in the funnel.

Add in a group by clause for your Initial UTM Source (campaign, content, etc.) to compare your different attribution sources. Now you can determine how each source/campaign is performing, how many users are entering through each channel, and the relative conversion rates to make data-driven decisions around ad spend.
Compare first touch/assisting touch
The report above is diving into those first touch properties, but frequently the user journey includes multiple touches before signing up. In order to analyze the first touch and assisting touch, add a Group by for UTM source of the landing page event.

Looking at the results we can see users first referred from Google, then who came in directly (no UTM source) completed the signup flow 10% of the time, and users who first came in through Google and then came in through Facebook converted 2% of the time.

For more information about UTM practices, visit our guide on Manual and Autotagging for Adwords.
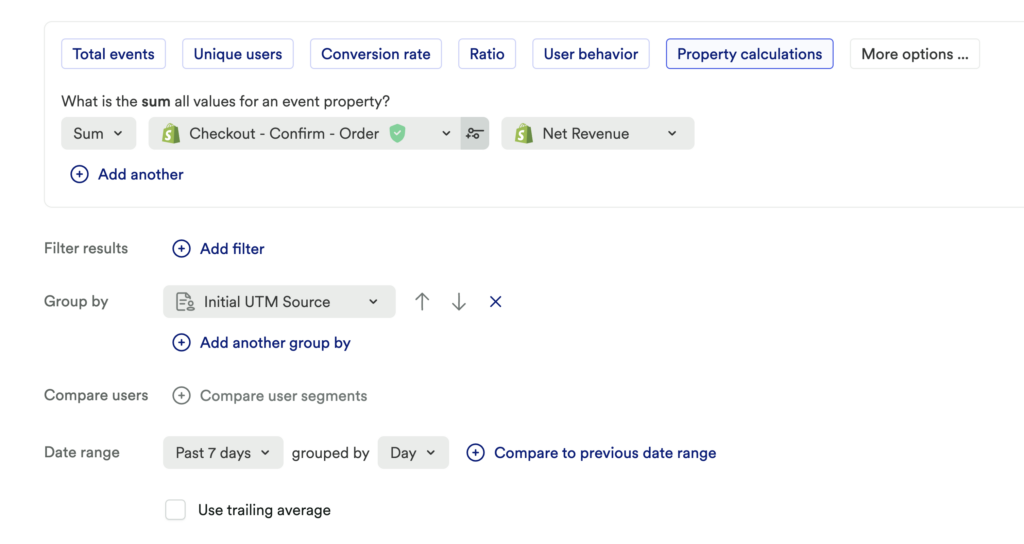
Analyze the revenue associated with each channel
It’s key to have an order confirmation or subscription/payment event to chart the overall revenue per channel within Heap. To analyze the revenue associated with each channel, select a Usage over time chart and select Property Calculations. Chart the Sum of your Order Confirmation/Checkout Event, and group by the UTM parameters. You can look at both first touch attribution (Initial UTM Source) or the campaign that directly led to the purchase!
