To make the most of this guide, you’ll need a baseline understanding of key concepts like events, charts, and properties. If you are still learning about Heap (meaning those terms don’t mean anything to you), we recommend taking our Hello Heap course or reviewing our Setting Up Heap guide prior to jumping into this guide.
This guide is meant to be used in tandem with one of Heap’s in-app Dashboard templates (linked in step 0). We recommend having the template and this guide open and working through them side-by-side.
Introduction
This template is most commonly used when setting up Heap for the first time to validate your data. Note that your chart results will vary widely based on your industry and dataset, and may not match the examples below.
Need help? Please post in Community or contact us via the Get support page in Heap.
Step 0: Open the in-app dashboard template
First things first: Open up the in-app dashboard template (linked directly below this line) so that you can complete these steps side-by-side.
In-app dashboard template: Data Validation
Step 1: Define the inputs needed for this dashboard template
To use this dashboard template, you’ll need to select some baseline inputs. In some cases, you’ll have the option to use a default Heap event or property.
If you need to create a new event or property as part of this process, see our guides on creating new events and properties.
Not sure what to put here? See a list of useful events for eCommerce, SaaS, and Financial Services businesses in the Industry Recommendations section of our Getting Started guide.
| Name | Description |
|---|---|
| User property | User property to validate that data meets your expectations. |
Business critical event | Event to check that the data meets your expectations. |
| Property for business critical event | Property for the event above. |
| Event with snapshot | An event with a snapshot property to validate that data meets your expectations. |
| Snapshot property | Snapshot property for the event above. |
| Initial marketing channel | A defined property that groups together similar initial marketing channels (e.g. Email, Display Ads) for a user. You can use the Heap default event for this. |
Step 2: Save your new dashboard
This dashboard will be automatically generated as you select your inputs. To save it for future reference, click the Save dashboard button at the top.
Chart Breakdown
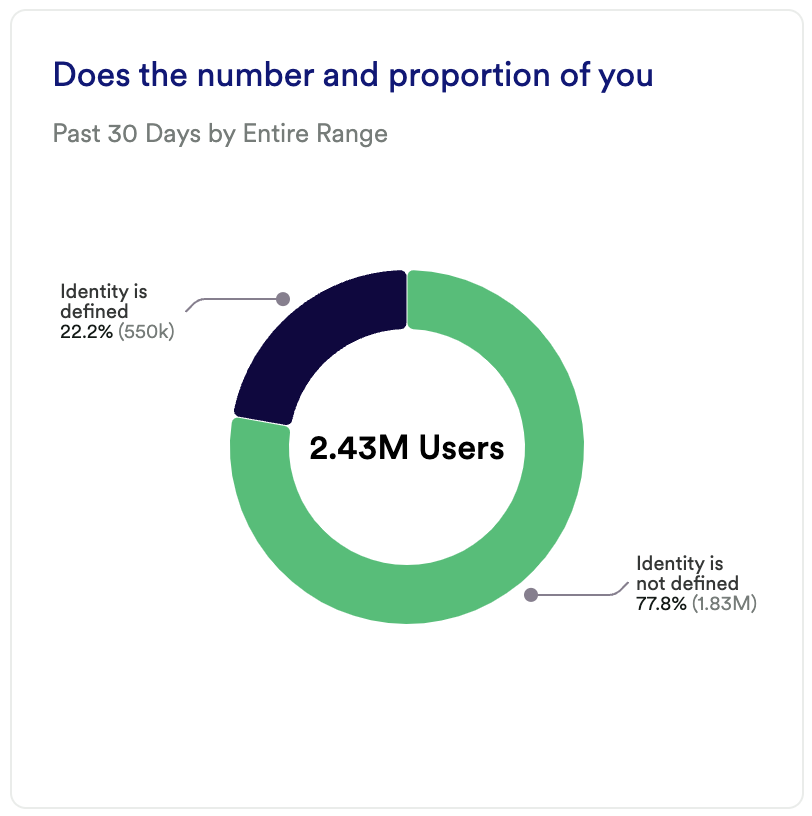
Chart 1: Does the number and proportion of your Users for which the user property is defined align with expectations?
What does it tell you?
This chart shows you the percentage of users who are identified vs. not identified.
How to interpret?
Use this chart to ensure your identifier is implemented properly. If there’s too high a percentage of undefined users, work with your developer to troubleshoot any implementation issues.
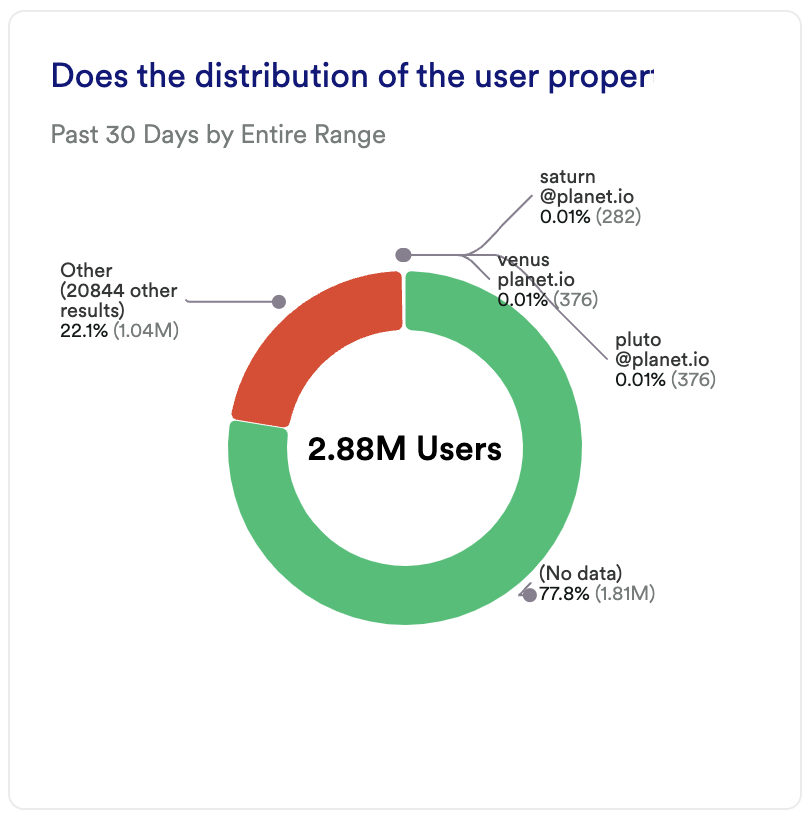
Chart 2: Does the distribution of the user property values align with expectations?
What does it tell you?
Does this breakout of users match what you see in your overall user set? in this example, the majority of users don’t have data as part of their user property.
How to interpret?
Does that align with your identity implementation? If not, consider revisiting your identity implementation with your developers.
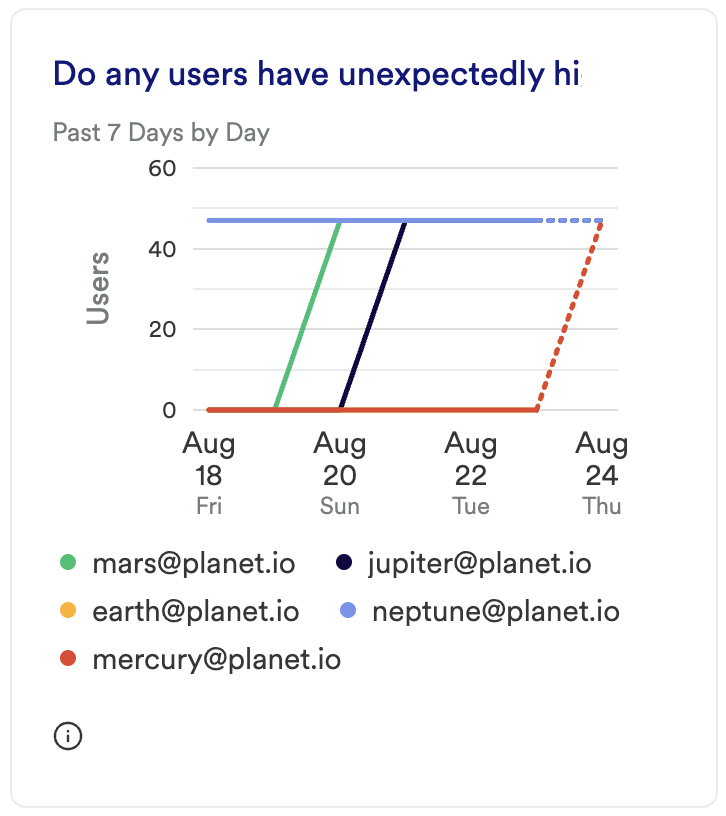
Chart 3: Do any users have unexpectedly high session volume?
What does it tell you?
Do any of your users users from over the past week have over 100 sessions?
How to interpret?
Are you seeing an unusual amount of power users? Check if this activity matches what you’re seeing from other sources.
If you’re seeing unwanted activity, such as bots or spam accounts, consider taking steps to block bot activity.
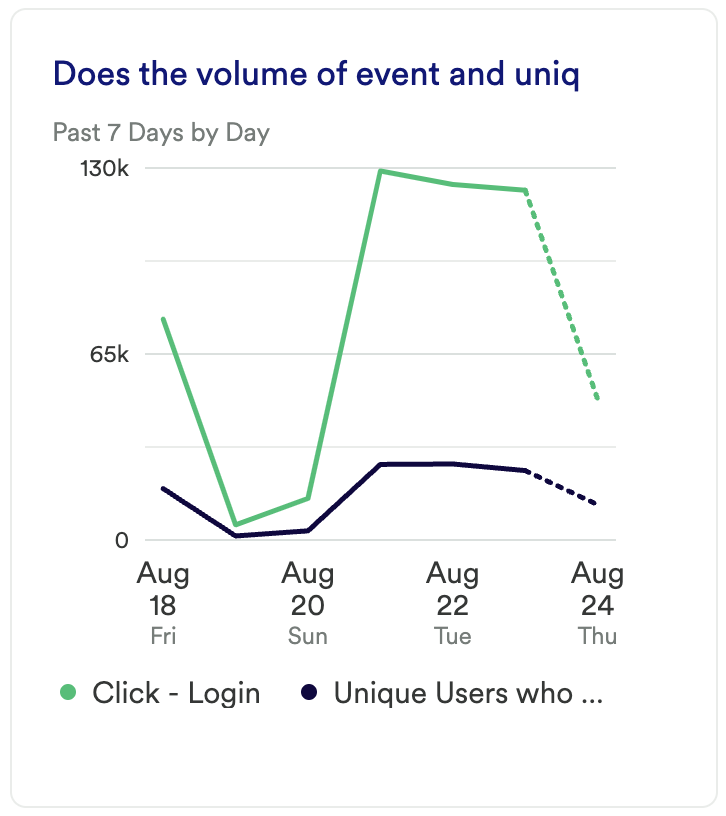
Chart 4: Does the volume of event and unique users who have done the event align with expectations?
What does it tell you?
For this event, do you see many users doing this event only once, or multiple times?
How to interpret?
Does this align with your expectations for this event (ex. a login or purchase event)? If not, you may want to check your implementation against other data sources.
Chart 5: Does the volume of your event group by property align with expectations?
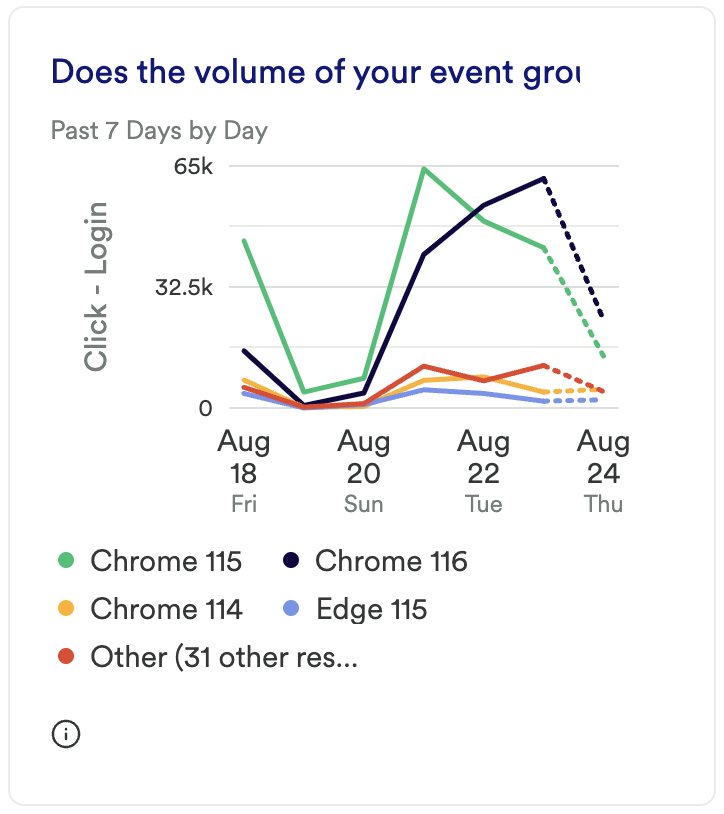
What does it tell you?
For any given event, does the volume of properties align with your expectations for this event? In this example, would you expect your users to mostly be on Chrome?
How to interpret?
Does this align with your expectations for this event and these properties? If not, you may want to check your implementation against other data sources.
Chart 6: Does the volume of an event with a snapshot property group by that property align with expectations?
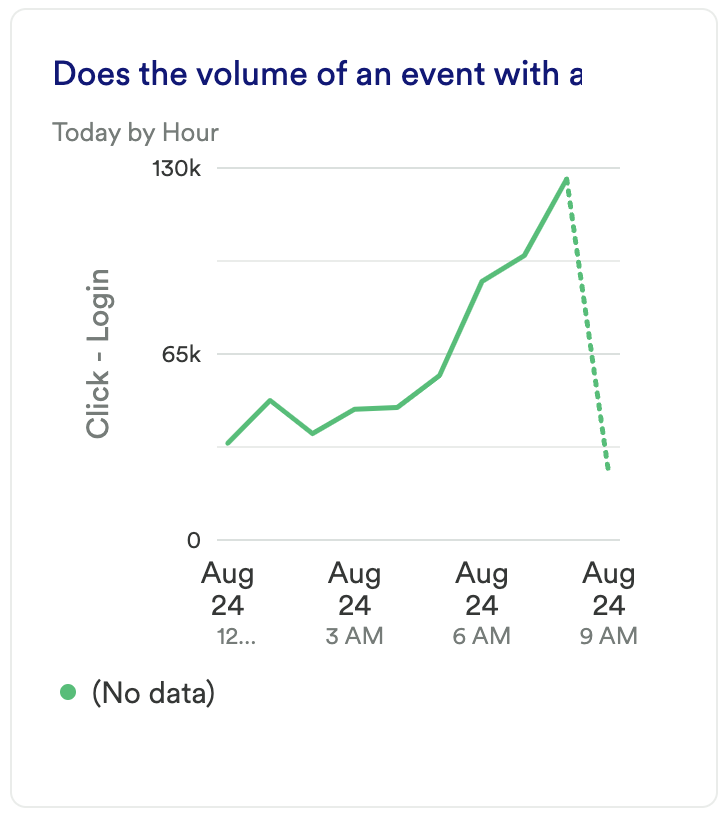
What does it tell you?
For any given event, does the volume of snapshot properties align with your expectations for this event?
How to interpret?
Is there a subset of data that is too large? If so, you may want to revisit the configuration of this snapshot property.
Chart 7: Where is Heap Installed?
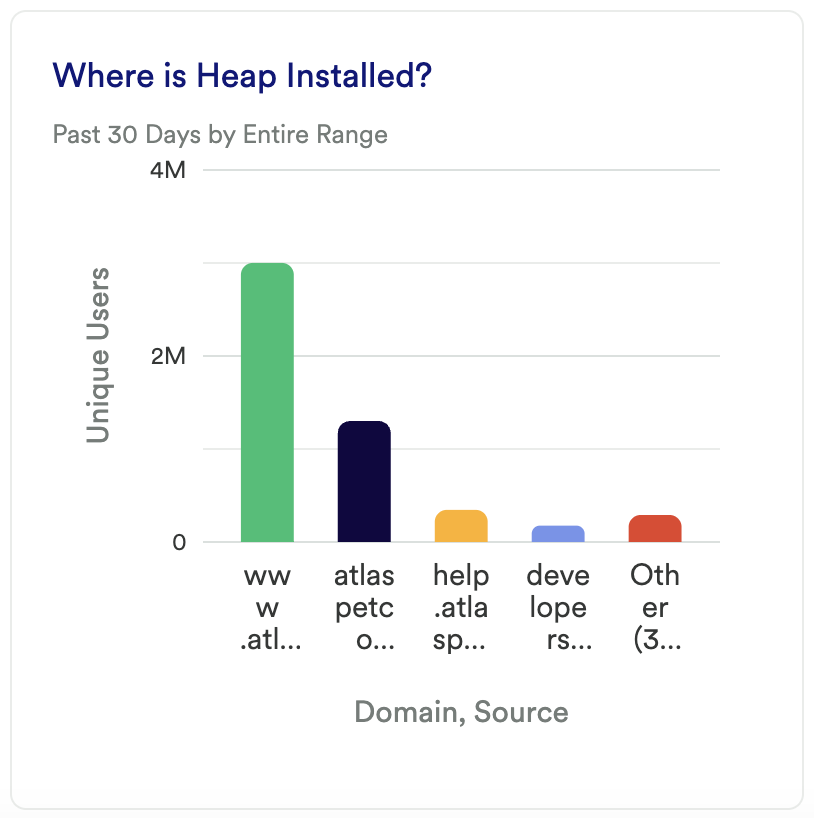
What does it tell you?
What domains is Heap installed on within this project?
How to interpret?
Does this list of domains match where you have installed Heap? Is any domain missing? If so, revisit your implementation with your developer.
Chart 8: How is the Marketing Channel Configured?
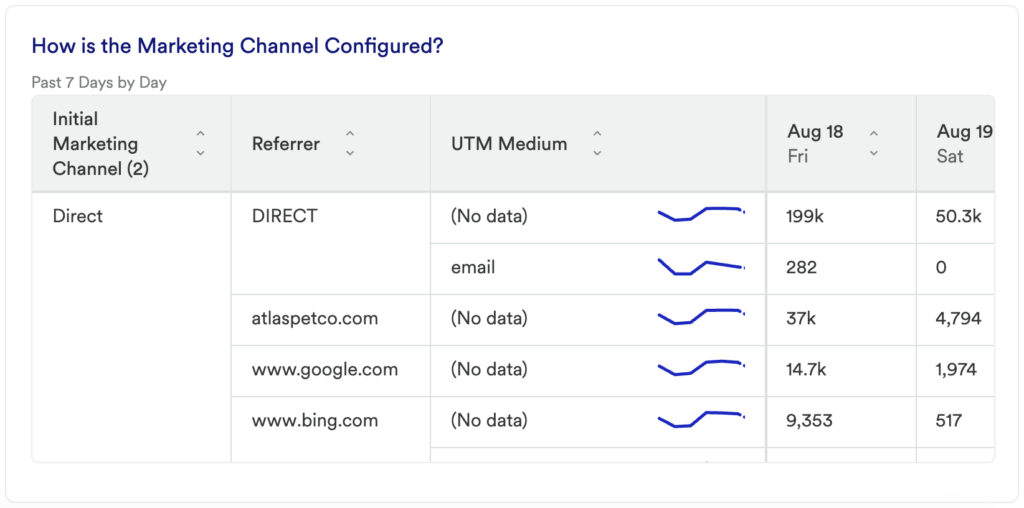
What does it tell you?
Based on the traffic seen here, is your marketing channel property set up appropriately?
How to interpret?
If one or more marketing channels are missing, or if these numbers don’t match what you’re seeing in other data sources, take a look at the conditions set for your marketing channel property to see what needs to be re-aligned.
In conclusion
The charts listed above are a useful resource for validating the accuracy of your data in Heap. If something doesn’t look right, we recommend reviewing the troubleshooting steps in I’m seeing a difference in data between Heap and another analytics tool. If you’ve already taken those steps and are still having issues, reach out to your Customer Success Manager, or contact us via the Get support page.