To make the most of this guide, you’ll need a baseline understanding of key concepts like events, charts, and properties. If you are still learning about Heap (meaning those terms don’t mean anything to you), we recommend taking our Hello Heap course or reviewing our Setting Up Heap guide prior to jumping into this guide.
This guide is meant to be used in tandem with one of Heap’s in-app Dashboard templates (linked in step 0). We recommend having the template and this guide open and working through them side-by-side.
If you’re new to analysis in Heap, we recommend reviewing Create Your First Chart, which covers helpful charts 101 info.
Introduction
Using a “quiz” to personalize recommendations? Use this dashboard to understand the impact of your quiz on conversion, order volume, and more.
Step 0: Open the in-app dashboard template
First things first: Open up the in-app dashboard template (linked directly below this line) so that you can complete these steps side-by-side.
In-app dashboard template: Quiz engagement & impact
Step 1: Define the inputs needed for this dashboard template
To use this dashboard template, you’ll need to select some baseline inputs. In some cases, you’ll have the option to use a default Heap event or property.
If you need to create a new event or property as part of this process, see our guides on creating new events and properties.
Not sure what to put here? See a list of useful events for eCommerce, SaaS, and Financial Services businesses in the Industry Recommendations section of our Getting Started guide.
| Name | Description |
| Start quiz | An event that captures starting a “quiz” experience aimed at personalizing recommendations on an eCommerce site. |
| Complete quiz | An event that captures finishing a “quiz” experience aimed at personalizing recommendations on an eCommerce site. |
| Order | An event that captures confirmation of a completed order, with an included property for the total price of the order |
| Total price | A property on the “Order” event that captures the total price of the order |
Step 2: Save your new dashboard
This dashboard will be automatically generated as you select your inputs. To save it for future reference, click the Save dashboard button at the top.
Chart Breakdown
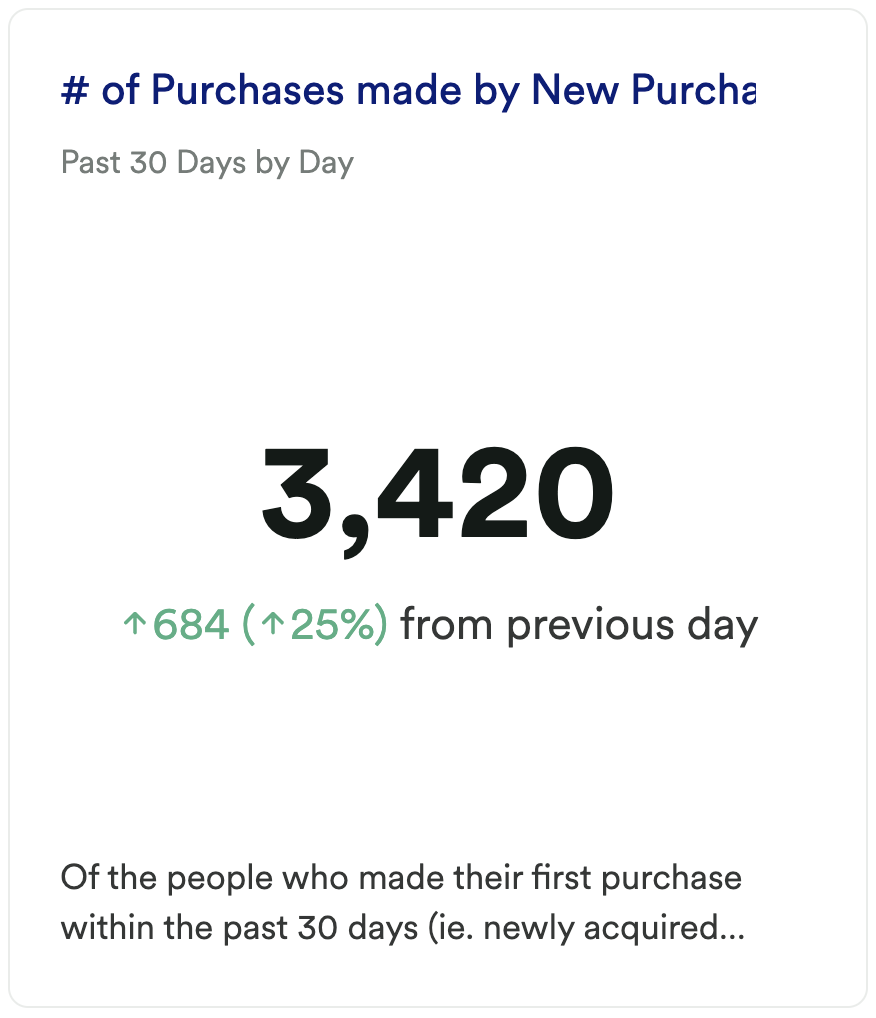
Chart 1: # of Purchases made by New Purchasers
What does it tell you?
Of the people who made their first purchase within the past 30 days (ie. newly acquired users), how many purchases did they make?
How to interpret?
This chart can provide you with a baseline understanding of how active your new users are, broken out by month.
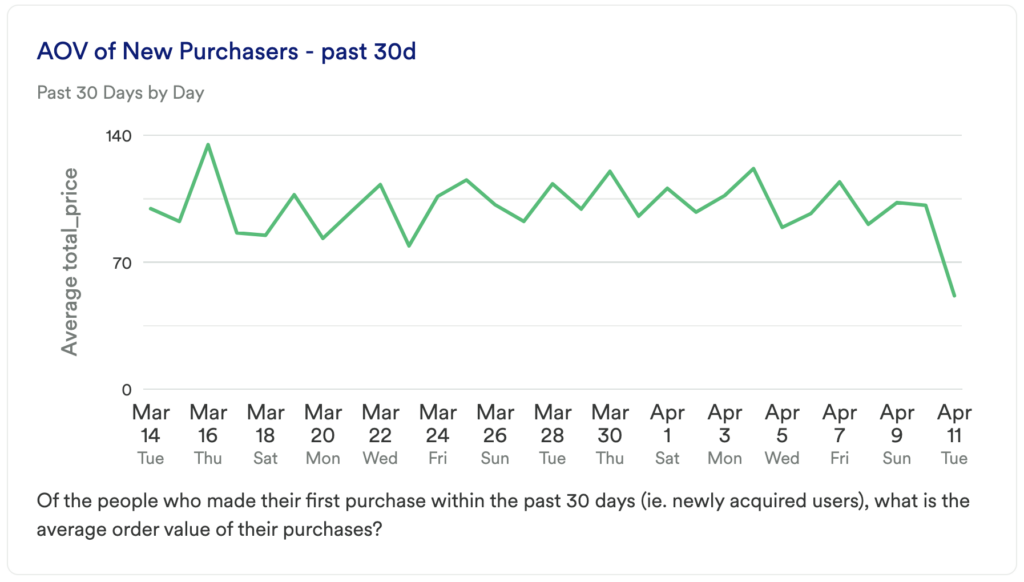
Chart 2: AOV of New Purchasers
What does it tell you?
Of the people who made their first purchase within the past 30 days (ie. newly acquired users), what is the average order value of their purchases?
How to interpret?
Understand the average order value of new customers. We recommend comparing this to other segments to get a full understanding of the impact you can have on new customers. Dig into the behaviors of this group to see what other behaviors they have done that lead to successful conversions.
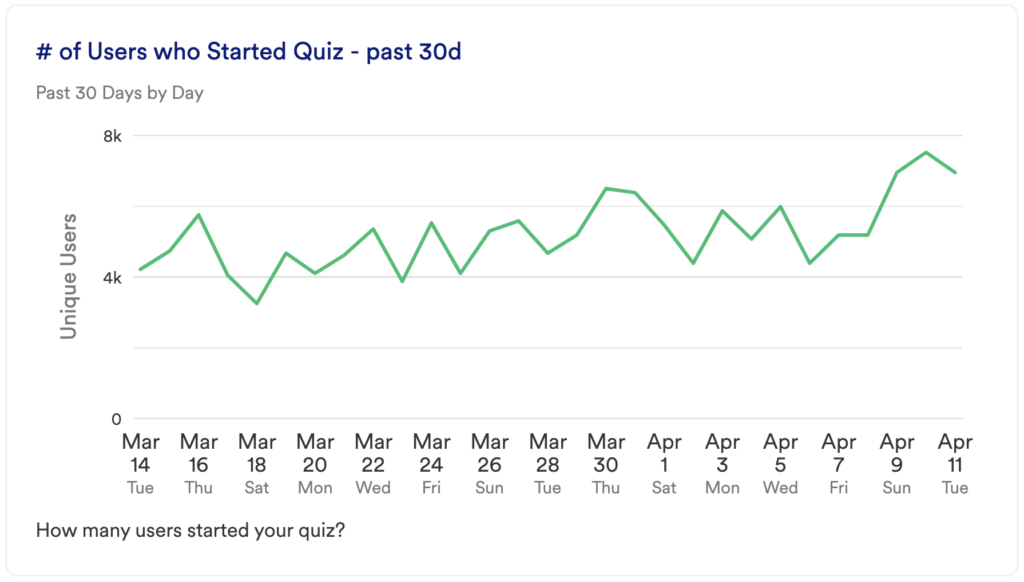
Chart 3: # of Users who Started Quiz
What does it tell you?
How many users started your quiz?
How to interpret?
If users are engaging with the quiz, this means they see some value in it, and are likely more engaged visitors.
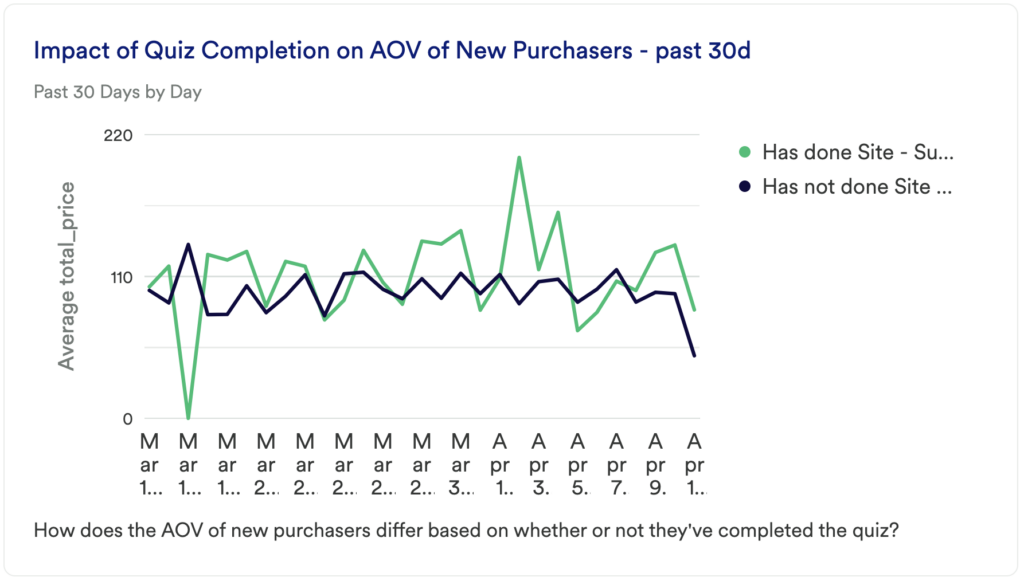
Chart 4: impact of Quiz Completion on AOV of New Purchasers
What does it tell you?
How does the AOV of new purchasers differ based on whether or not they’ve completed the quiz?
How to interpret?
If users tend to complete quizzes, but don’t end up buying anything, you may need to change the CTA users are exposed to at the end of the quiz. If users don’t tend to complete quizzes, but those who do have an extremely high conversion rate, then you may want to spend time optimizing the actual quiz experience.
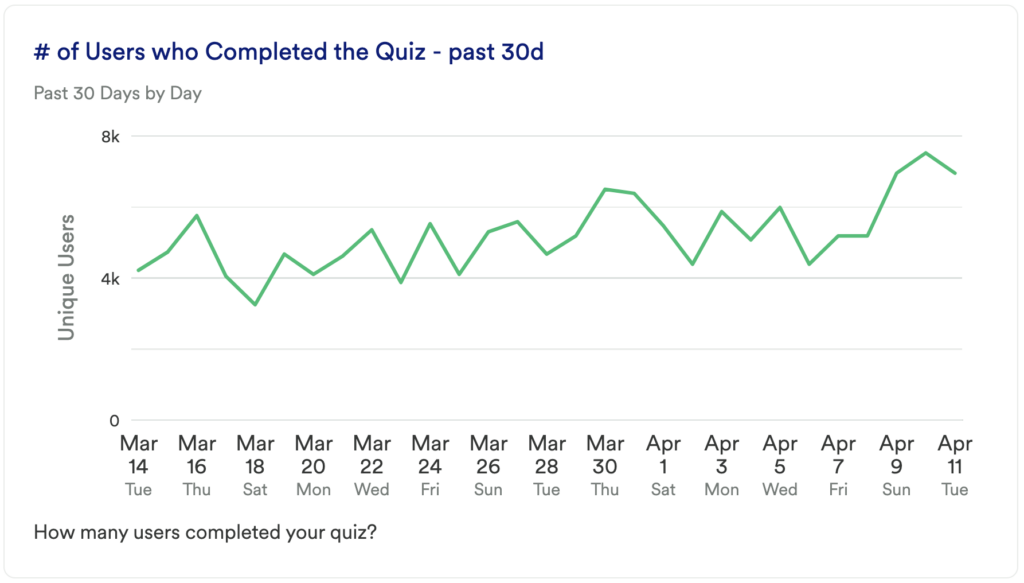
Chart 5: # of Users who Completed the Quiz
What does it tell you?
How many users completed your quiz?
How to interpret?
This gives you an understanding of if users are finding the quiz valuable and if it is easy to use. Compare this to chart #4 to see if users are starting and completing!
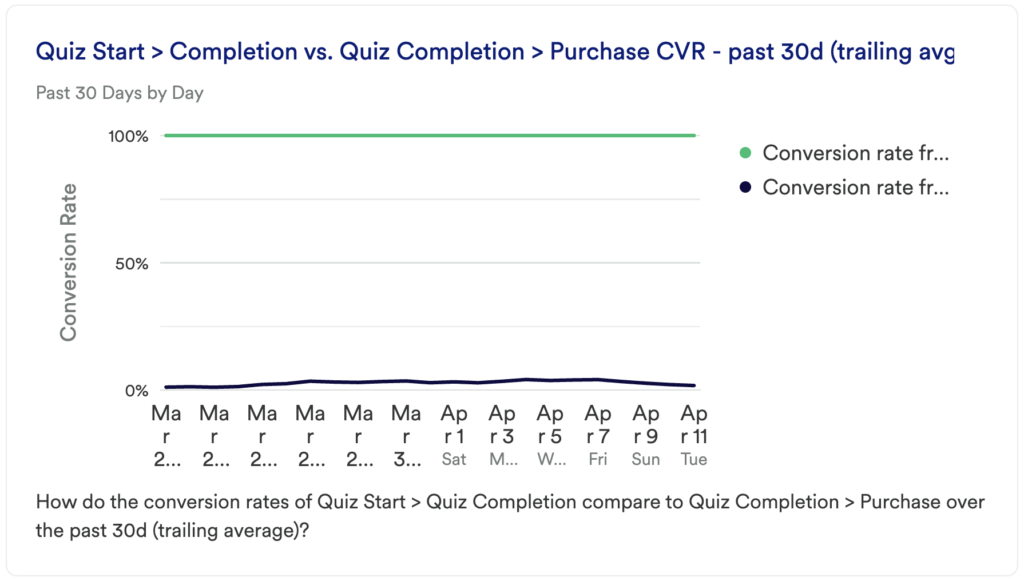
Chart 6: Quiz Start > Completion vs. Quiz Completion > Purchase CVR
What does it tell you?
How do the conversion rates of Quiz Start > Quiz Completion compare to Quiz Completion > Purchase over the past 30d (trailing average)?
How to interpret?
Use this chart to get a baseline understanding and comparison of those who complete the quiz against those who complete the quiz and make a purchase.
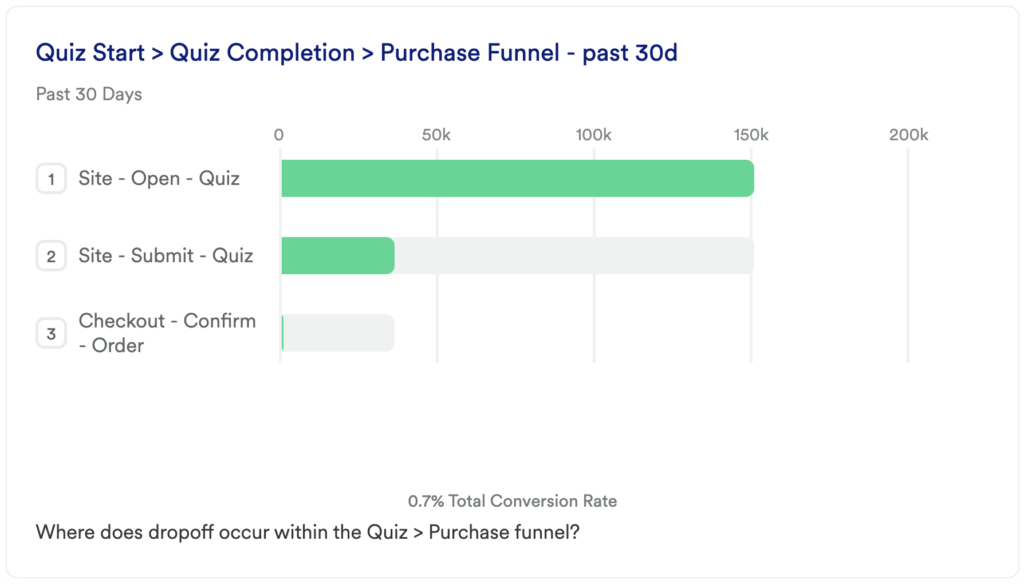
Chart 7: Quiz Start > Quiz Completion > Purchase Funnel
What does it tell you?
Where does drop-off occur within the Quiz > Purchase funnel?
How to interpret?
Is purchase conversion higher for those users who complete your quiz or form?
If yes, then you will want to continue optimizing the form by improving any points of drop-off that were discovered in the funnel analysis, as well as making your quiz more discoverable. Continue digging into analysis to understand if any marketing efforts have had an impact on completion success, or if there are any other actions successful purchasers take before completing the quiz.
If no, then you will want to continue optimizing your form completion by digging deeper into drop-off points, analyzing what users are doing instead of your quiz, and run some A/B tests, if you have not already done so.
Step 3: Take action
Quizzes and forms can have a major impact on a customer’s desire to make a purchase. Quizzes like, “which type of dog food is right for my pet?” or “which size of this brand is right for me?” can help customers navigate your site more easily, move with intention, and ensure they are purchasing the right thing – ultimately delighting your customers and increasing lifetime value.
Forms asking customers about their experience, or even if they want to be contacted when an out-of-stock item is in stock, can build a rapport with customers and ensure some level of retention.
In conclusion
Ensure your customers have a quality purchase experience by optimizing any forms or quizzes that they might fill out can go a long way in customer delight, retention and lifetime value.