To make the most of this guide, you’ll need a baseline understanding of key concepts like events, charts, and properties. If you are still learning about Heap (meaning those terms don’t mean anything to you), we recommend taking our Hello Heap course or reviewing our Setting Up Heap guide prior to jumping into this guide.
This guide is meant to be used in tandem with one of Heap’s in-app Dashboard templates (linked in step 0). We recommend having the template and this guide open and working through them side-by-side.
If you’re new to analysis in Heap, we recommend reviewing Create Your First Chart, which covers helpful charts 101 info.
Introduction
Use this guide to understand retention, churn, and more for your eCommerce subscription.
Step 0: Open the in-app dashboard template
First things first: Open up the in-app dashboard template (linked directly below this line) so that you can complete these steps side-by-side.
In-app dashboard template: Subscription retention
Step 1: Define the inputs needed for this dashboard template
To use this dashboard template, you’ll need to select some baseline inputs. In some cases, you’ll have the option to use a default Heap event or property.
If you need to create a new event or property as part of this process, see our guides on creating new events and properties.
Not sure what to put here? See a list of useful events for eCommerce, SaaS, and Financial Services businesses in the Industry Recommendations section of our Getting Started guide.
| Name | Description |
| Order | An event that captures confirmation of a completed order, with an included property for the total price of the order. |
Step 2: Save your new dashboard
This dashboard will be automatically generated as you select your inputs. To save it for future reference, click the Save dashboard button at the top.
Chart Breakdown
Chart 1: Subscription Retention
What does it tell you?
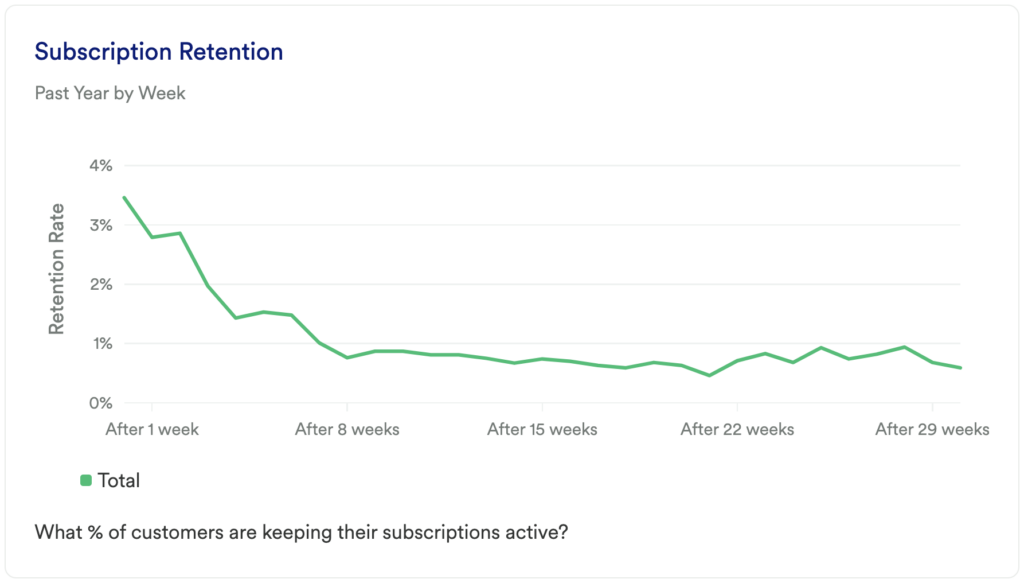
This chart will show you what % of your customers continue to keep their subscription active. It will tell you the frequency with which your users return to complete your desired return event.
How to interpret?
If you see a large dip at the start of your chart, don’t panic! This is normal, especially as users first sign up for the subscription. The key here is seeing improvement over time and to have an upwards trend after any initial fall-off.
Chart 2: Subscription Churn
What does it tell you?
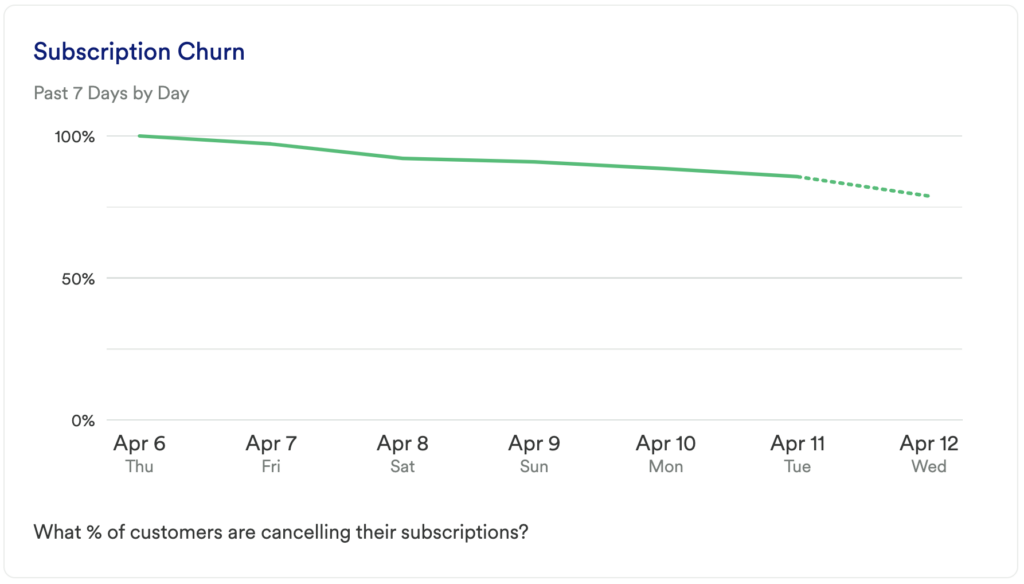
What % of customers are cancelling their subscriptions?
How to interpret?
You want to look for a small ratio here. The smaller the number, the fewer amount of churn you have. If you notice any spikes in your chart, that is worth investigating since it indicates a spike in churn.
Chart 3:
What does it tell you?
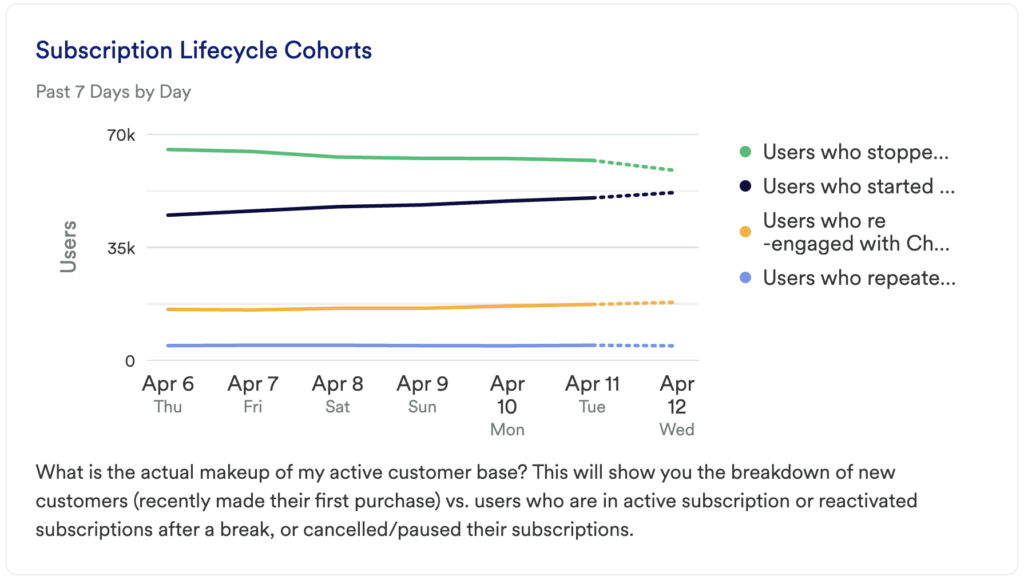
What is the actual makeup of my active customer base?
How to interpret?
This will show you the breakdown of new customers (recently made their first purchase) vs. users who are in active subscription or reactivated subscriptions after a break, or cancelled/paused their subscriptions.
Chart 4: Repeat Purchase Rate
What does it tell you?
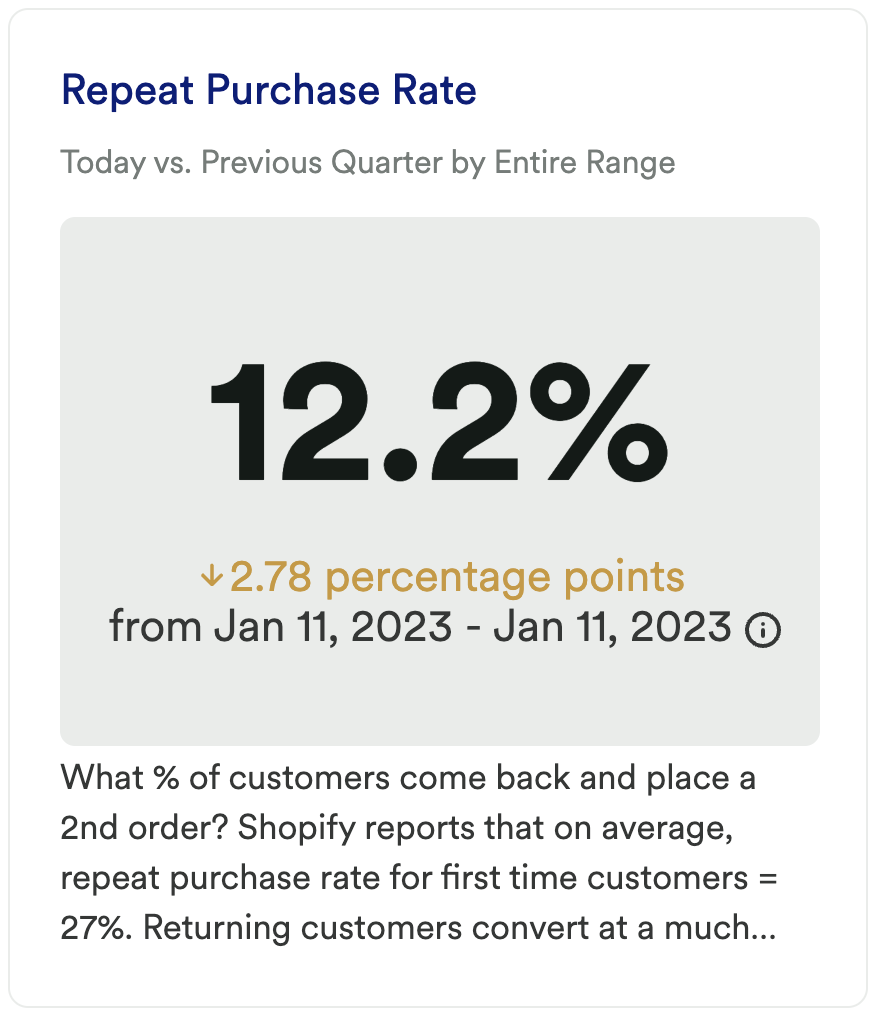
What % of customers come back and place a 2nd order?
How to interpret?
Shopify reports that on average, repeat purchase rate for first-time customers = 27%. Returning customers convert at a much higher rate than first-time customers. Investing in improving RPR could be more impactful than the conversion rate for first-time customers.
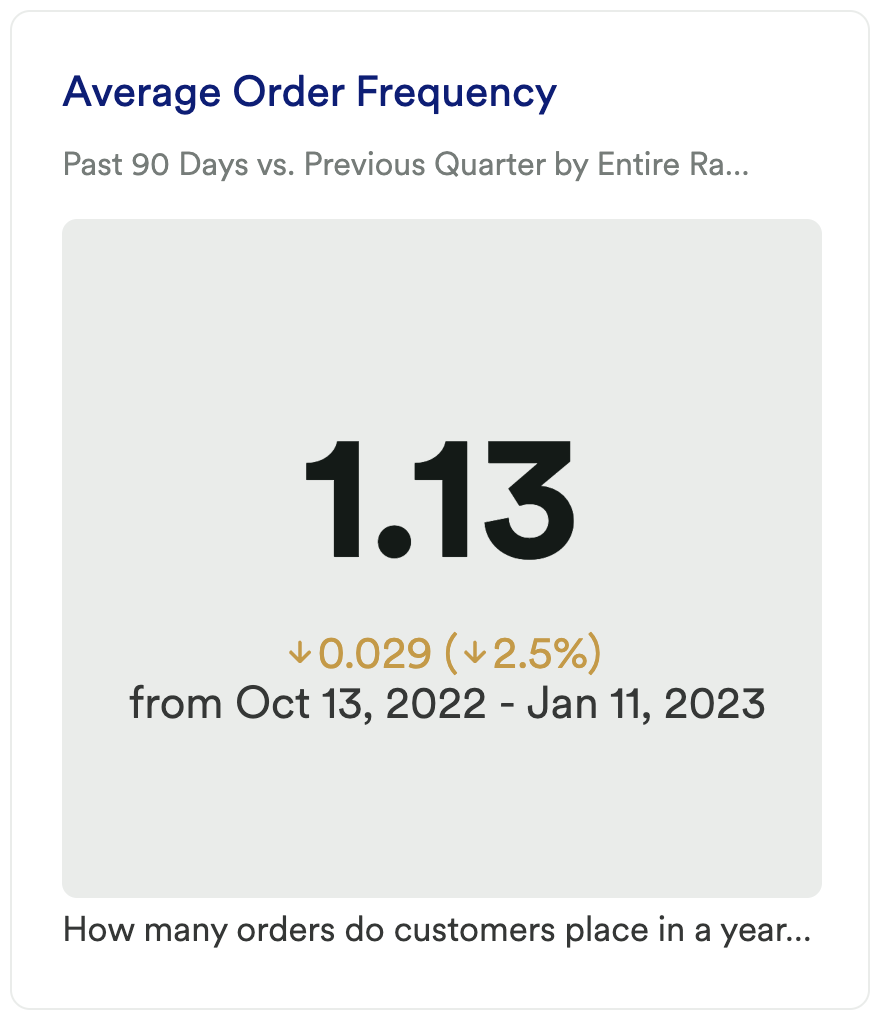
Chart 5: Average Order Frequency
What does it tell you?
How many orders do customers place in a year, on average?
How to interpret?
The higher the number, the better, since a higher number indicates customers are returning to make more than one purchase. We recommend filtering this chart by those who are subscription holders so you have a more refined dataset.
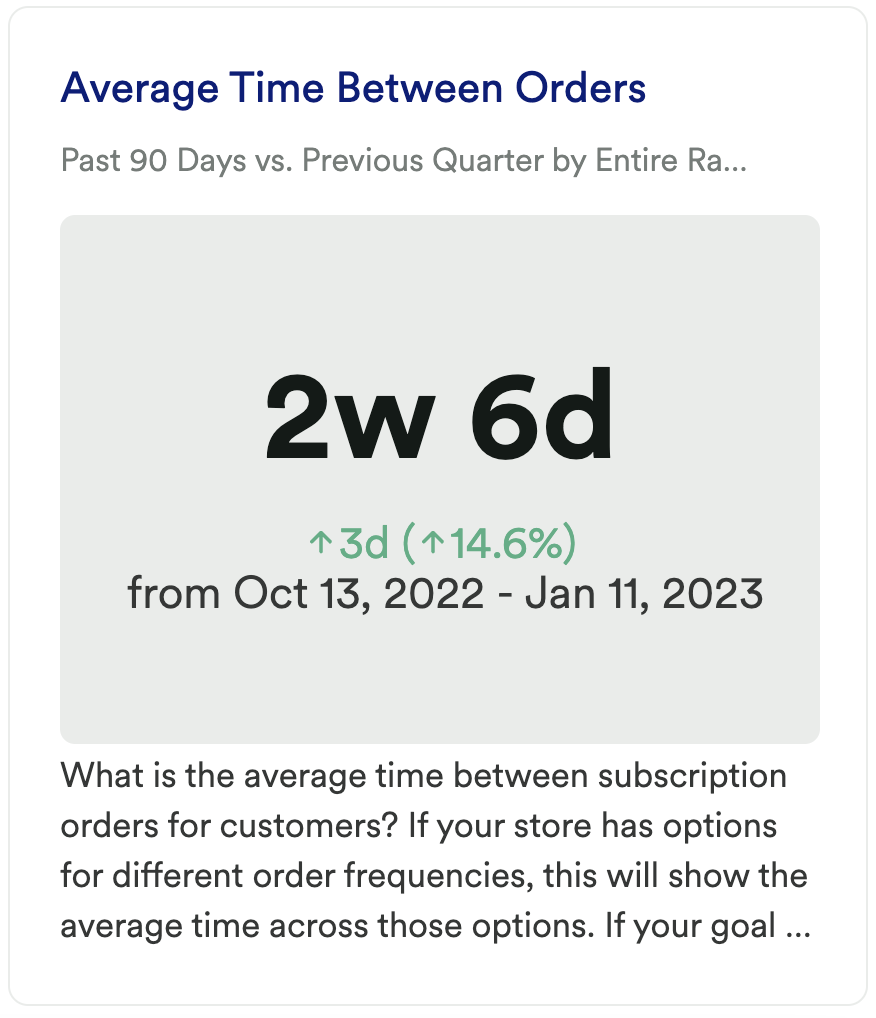
Chart 6: Average Time Between Orders
What does it tell you?
What is the average time between subscription orders for customers?
How to interpret?
If your store has options for different order frequencies, this will show the average time across those options. If your goal is to drive more frequent orders, this duration should decrease over time.
Step 3: Take action
Refining your subscription retention strategy is a never-ending process, and there’s no silver bullet that we can give you here. However, this dashboard should give you an idea of how you might want to invest your time over the next month or next quarter; are subscribers making more purchases than non-subscribers? Then how do we acquire more subscribers? Is the repeat purchase rate for subscribers abnormally low, well then it is worth investigating why.
Then, keep measuring! This is an iterative process. Get the data, look for insights, take action, then go back to the data to measure the results of your work!
In conclusion
It’s getting harder and harder to acquire new customers, so it’s important that you use all of the tools you can to make sure that you acquire more than your competitors, and subscriptions are a great starting point. Using data to inform your subscription development strategy is an important step to ensuring that you grow your business.