To make the most of this guide, you’ll need a baseline understanding of key concepts like events, charts, and properties. If you are still learning about Heap (meaning those terms don’t mean anything to you), we recommend taking our Hello Heap course or reviewing our Setting Up Heap guide prior to jumping into this guide.
Introduction
Understanding which prospective customers are maximizing your tool to the fullest extent during a trial period can have a major impact on your sales conversion funnel. This guide provides you with an understanding of how to help your sales team know where to focus their efforts.
If you’re new to analysis in Heap, we recommend reviewing Create Your First Chart, which covers helpful charts 101 info.
Step 1: Add account details to Heap
To start, make sure appropriate account-level data, like name, industry, Account Executive, trial status, and more, is being brought into Heap. This is powerful information that can be used in more ways than just this guide!
Adding this data to Heap can be accomplished through our robust Salesforce Integration or via our APIs. For more details on how to add this to your account, check out our guide to account health analysis.
Step 2: Segment Trial from Paid Users
Before running any analysis, you will need to build a segment of users who are part of your free trial. Think of where you track which accounts and users are paid, and which are in the trial stage, and be sure this information is brought into Heap at the user level so you can build your segment!
Step 3: Analyze your features!
Now that you have your data in Heap, it’s time to analyze it!
Chart 1: How many Trial Accounts are active?
Set up an Account Analysis usage over time chart with the following criteria:
- Accounts with at least 1 users matching the criteria
- Users who are in segment: Trial Users
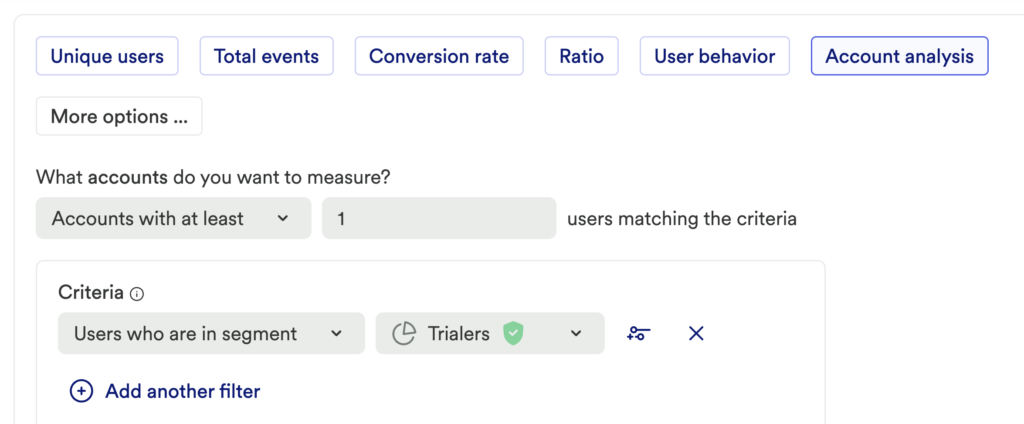
- Group by: Account Name (or your company’s equivalent)
What does this tell you?
Of the accounts that have an open free trial, which accounts are active within your designated time range?
Chart 2: Based on Pageviews, how active is each account?
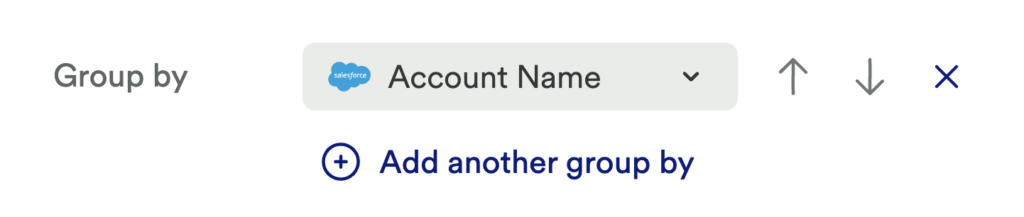
Set up another usage over time chart looking at the Total events with the following criteria:
- Count Pageview* or appropriate event
- Filter: Users who are in segment Trial Users
- Group By: Account Name (or your company’s equivalent)
*Note: you can replace Pageview with any desired event
What does this tell you?
This chart displays which of your accounts are most or least active in terms of pageviews (or your desired event) for a given time period. You can extend the Date Range or Add a Comparison to see how pageview trends change over time.
Chart 3: How many users in my Trial Accounts are active?
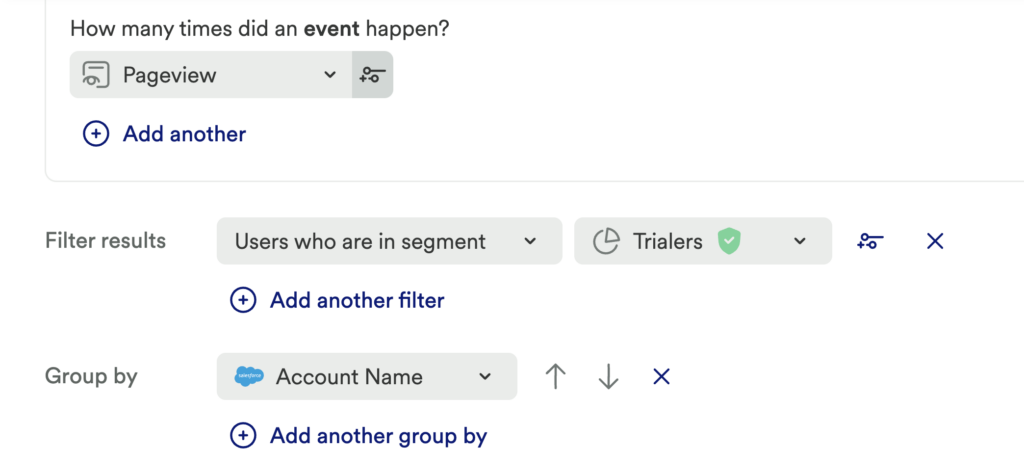
Set up another usage over time chart looking at User Behavior with the following criteria:
- Users who are in segment Monthly Active Users
- Filter: Trial Users
- Group By: Account Name (or your company’s equivalent)
What does this tell you?
This chart displays the number of Monthly Active Users who are in a trial, broken out by each account in your book of business.
Chart 4: What are the most-utilized features for a specific account?
Set up another usage over time chart looking at Total Events with the following criteria:
- Count of Pageview
- Filter: Account Name (or equivalent) Contains [Account Name]
- Group By: Title
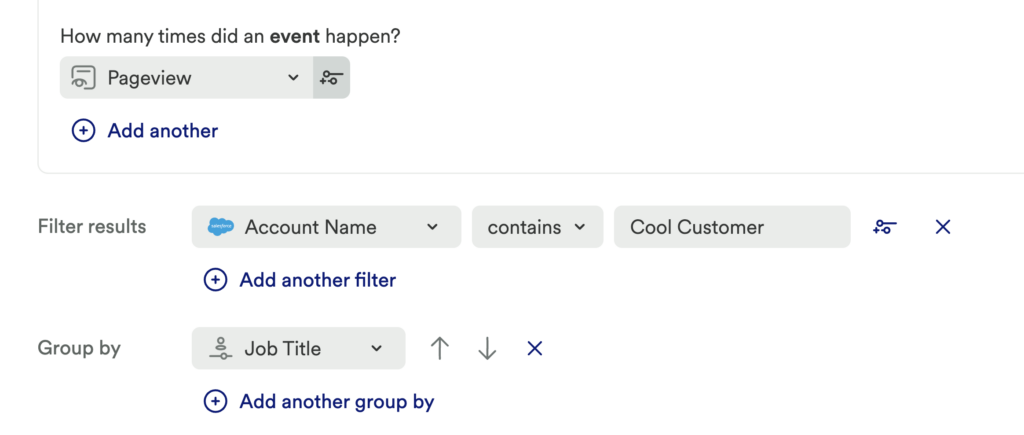
What does this tell you?
This chart displays the most popular pages viewed by those users at the company you have filtered for.
Want to look at specific events, and not Pageviews?
If you want to look at specific events, rather than pageviews, you can compare activity by creating a multi-line chart. To do this, you will simply click the + Add button. Add as many Events as you desire so you can directly compare interaction with those different events. Be sure to remove the Group By since it isn’t needed here!
Chart 5: Who are the active users in a specific account?
Last but not least, set up another usage over time chart looking at Total events with the following criteria:
- Count Unique and Session
- Filter: Account Name or equivalent Contains desired account
- Group By: identity or contact email
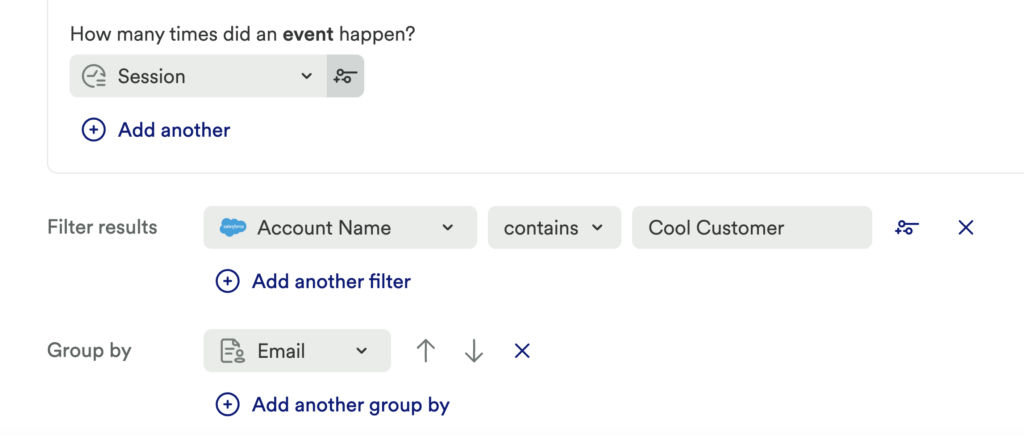
What does this tell you?
This chart displays the individual active users at the company you have filtered for.
Step 4: Interpret your results and take action
Knowing which accounts have a lot of activity across users, which accounts have one or two active users, and which accounts aren’t taking advantage of the trial at all will impact your sales strategy, and help determine which prospects should be engaged with first.
Conclusion
These charts will help boost your confidence that your team is spending their time wisely by directing your sales efforts to where they are needed the most. Definitively understanding which of your prospects are engaging with the tool during a free trial, and which aren’t, allows you and your team to adjust your outreach strategies accordingly.
Additional custom account properties (optional)
Below are more account-level properties that you may want to bring into Heap:
| Property | Description |
|---|---|
| Account Tier | How the account is tiered based on your organization’s CRM. Additional related properties could include company size and/or account revenue. |
| Account Vertical | What industry the account falls under. |
| Account Owner | Which sales representative owns the account. |
| First Contact Date | When the company was first contacted by a sales representative. |
| Deal Close Date | The date that the contract was signed. |
| Account Location | Region/city the account is based in. |