To make the most of this guide, you’ll need a baseline understanding of key concepts like events, charts, and properties. If you are still learning about Heap (meaning those terms don’t mean anything to you), we recommend taking our Hello Heap course or reviewing our Setting Up Heap guide prior to jumping into this guide.
This guide is meant to be used in tandem with one of Heap’s in-app Dashboard templates (linked in step 0). We recommend having the template and this guide open and working through them side-by-side.
If you’re new to analysis in Heap, we recommend reviewing Create Your First Chart, which covers helpful charts 101 info.
Introduction
Taking time to build out in-app guides can be an excellent tool when getting users to adopt a feature in your product, though oftentimes, we don’t take the time to measure the impact of those guides. Knowing if a guide is being interacted with and having the desired impact on your feature can ensure your team is investing resources in an impactful way.
Step 0: Open the in-app dashboard template
First things first: Open up the in-app dashboard template (linked directly below this line) so that you can complete these steps side-by-side.
In-app dashboard template: In-app guide performance
Step 1: Define the inputs needed for this dashboard template
To use this dashboard template, you’ll need to select some baseline inputs. In some cases, you’ll have the option to use a default Heap event or property.
If you need to create a new event or property as part of this process, see our guides on creating new events and properties.
Not sure what to put here? See a list of useful events for eCommerce, SaaS, and Financial Services businesses in the Industry Recommendations section of our Getting Started guide.
| Name | Description |
| Guide started | An event that captures the user starting an in-app guide |
| Guide completed | An event that captures the user completing an in-app guide |
| Active usage | A user action that you use to define an active user when counting daily/weekly/monthly active users (choose “Session” if you define an active user as any visitor) |
Step 2: Save your new dashboard
This dashboard will be automatically generated as you select your inputs. To save it for future reference, click the Save dashboard button at the top.
Chart Breakdown
Chart 1: Guide Usage
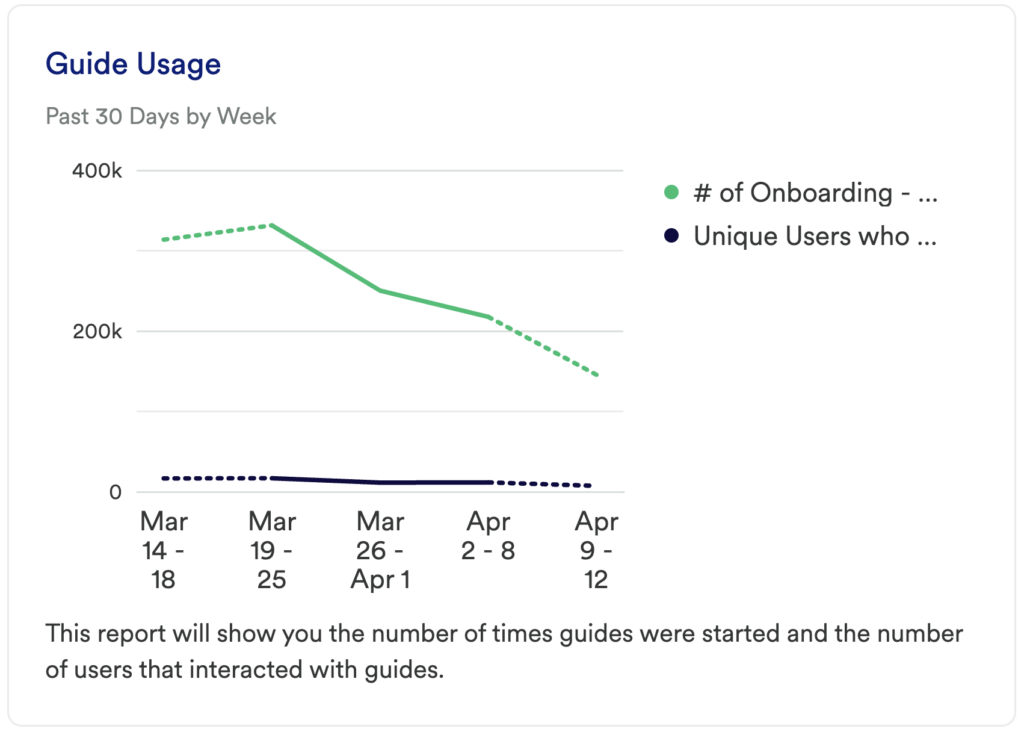
What does it tell you?
This chart will tell you not only the number of times your guide has been started over the past 30 days, but it will directly compare that to the unique number of users who successfully completed your guide.
How to interpret?
This chart will let you know if users are interacting with your guide, and how many times the guide has been interacted with overall. Comparing this to the number of users who finish your guide can be very telling. Are the same few users using the guide repeatedly, or is there an even spread of starting a guide and finishing it?
It is best practice to look at this by segment to understand the impact of the guide on different groups of users.
Chart 2: Guide Conversion Rate
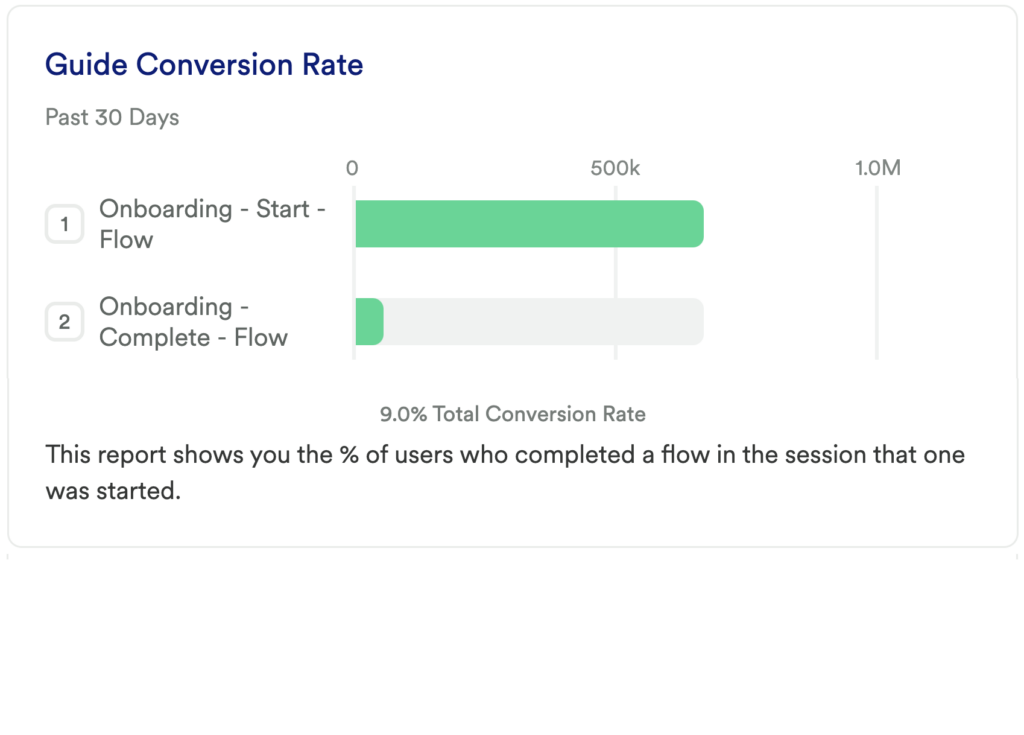
What does it tell you?
This chart will show you how many of your new users in the last 30 days completed your primary conversion event.
How to interpret?
Not only will this show you if the guide is being interacted with, but it will let you know if users are finding value in the guide by finishing it. Are you seeing a large drop-off in start to finish? That may indicate there is interest to learn more about the feature, but the guide needs to be improved. Are you not seeing many users interacting with the guide in general? That may indicate there is not much interest in that particular feature and can either be sunsetted or need to be revamped!
Chart 3: Guide Impact on Retention
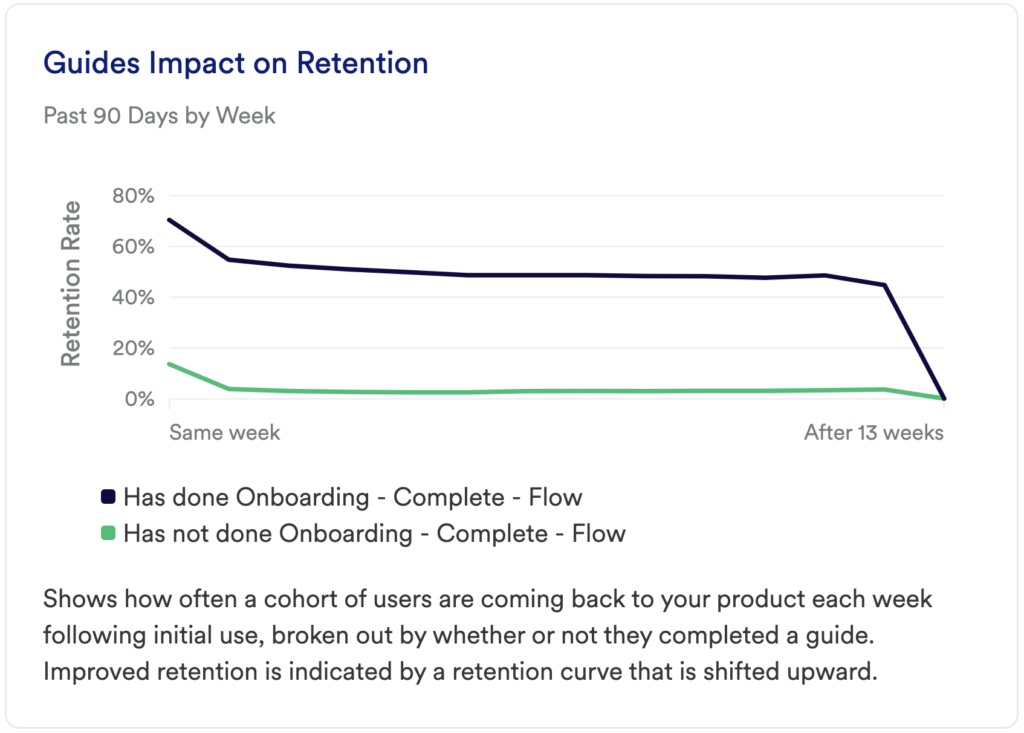
What does it tell you?
Understand if your guide is having any impact on users continuing to engage with the desired feature, and how often.
How to interpret?
This chart shows if users continue returning to complete your active usage event after initial use, and is broken out by whether or not they completed your guide. This highlights how frequently they return to complete your usage event.
It is common to see a drop-off at the beginning of the line chart as users are getting acquainted with your tool or experimenting. Retention of users is indicated by an upwards tick at the end of the line chart. If the line continues to go down, that lets us know that users are not finding value and are not returning to complete the desired event, and ultimately are not being retained.
Step 3: Take action
If your guide was a success, great! If not, it might be worth taking a deeper look at the overall usage of the features you created guides for and considering if they need to be improved, or depreciated.
Did targeted users engage with the guide? If not, it might be worth revisiting who you target or if the Key Event is even usable. Did users open the guide and not finish it? This can tell you the guide needs to be reworked so your targeted users find value in going through it.
Then, keep measuring! This is an iterative process. Get the data, look for insights, take action, then go back to the data to measure the results of your work!
In conclusion
In-app guides are a powerful way to drive adoption and sustained usage of your tool, so measuring your guide’s impact on these metrics should be a point of focus.