To make the most of this guide, you’ll need a baseline understanding of key concepts like events, charts, and properties. If you are still learning about Heap (meaning those terms don’t mean anything to you), we recommend taking our Hello Heap course or reviewing our Setting Up Heap guide prior to jumping into this guide.
Introduction
Quizzes and forms can have a major impact on a customer’s desire to make a purchase. Quizzes like, “which type of dog food is right for my pet?” or “which size of this brand is right for me?” can help customers navigate your site more easily, move with intention, and ensure they are purchasing the right thing – ultimately delighting your customers and increasing lifetime value. Forms asking customers about their experience, or even if they want to be contacted when an out-of-stock item is in stock, can build a rapport with customers and ensure some level of retention.
Use Heap to analyze the results of quizzes and forms on your site so you can optimize your quiz and purchase funnels, leading to higher retention and increasing your overall customer lifetime value.
If you’re new to analysis in Heap, we recommend reviewing Create Your First Chart, which covers helpful charts 101 info.
Step 1: Define all relevant quiz events
First things first – let’s make sure all of the data you need is in Heap! Define all relevant events for each step of your form/quiz, such as “start quiz,” “submit” and any important text field interactions. Additionally, you will need to define each step of the purchase funnel, like “add to cart,” “purchase,” etcetera. For guidance on setting up events, see our Events overview.
Use Snapshots to define field content inputs
For privacy and security purposes, Heap only captures if a text field is clicked into. If you wish to capture the content input into the field, you will need to define a Snapshot. Admin and Architects – check out this guide on defining Snapshots.
Step 2: Bring in any A/B test details into Heap, if applicable
For teams testing multiple versions of a form or quiz, it is important that all of your quiz variation details are in Heap for you to run analysis on.
If you are using a testing tool for your A/B variations, you can check out this list of integrations to see if your testing tool has a standard integration. If you are not using a testing tool that has an integration with Heap, no fear! You can always use Heap’s API capability to bring in custom properties.
If enriching via an API…
It is vital this information is brought into Heap in a way that allows you to properly run your analysis. Your CSM can discuss with you the difference between user and event properties and the impact it will have on the types of charts you can run, otherwise refer to this Track article.
Step 3: Create appropriate Segments
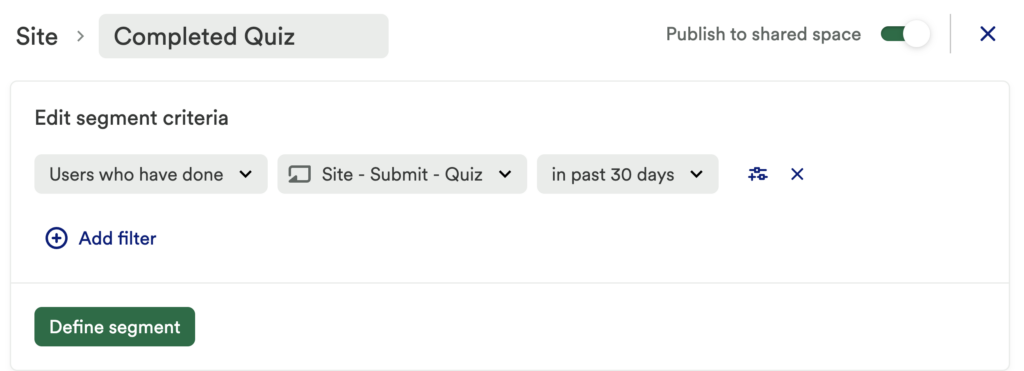
Next, create a behavior-based segment of users who have completed your quiz or form that can then be used in your analysis. For details on the importance of segments or how to make a segment, check out Segments overview.
Feel free to change the segment’s time range from “at any time” to a time-bounded window, depending on what makes sense for the form of interest. If completing the quiz permanently changes the way you think about a user’s lifetime value, then it may make sense to define this segment as “at any time.” However, if completing the quiz has a time-limited effect on a user (e.g. may increase their likelihood to purchase within 30 days) then change the time range accordingly.

For those who are A/B testing their forms or quizzes, be sure to create additional segments for users exposed to version A versus version B. Our guide to A/B Testing can help you navigate defining your variants.
Step 4: Analyze your features!
Now it’s time to analyze your features! This section will cover how to create charts that establish baselines for how many people go through the quiz(es), quiz completion rates, and the impact of quiz completion on overall purchase conversion.
Charts 1-3: Baseline charts
To start off with a baseline, set up three usage over time charts with the following criteria:
- Conversion Rate Between the Quiz Start and Quiz Completion
- Conversion Rate Between the Quiz Completion and Purchase
- Count Unique Purchase grouped by Completed Quiz segment

What do these tell you?
These three charts allow you to establish baselines for what your quiz completion rates are and what the purchase conversion rate is after someone has completed a quiz. This helps you isolate the areas you may want to optimize.
For example, if users tend to complete quizzes but don’t end up buying anything, you may need to change the CTA users are exposed to at the end of the quiz. If users don’t tend to complete quizzes but those who do have an extremely high conversion rate, then you may want to spend time optimizing the actual quiz experience.
Chart 4: Baseline funnel charts
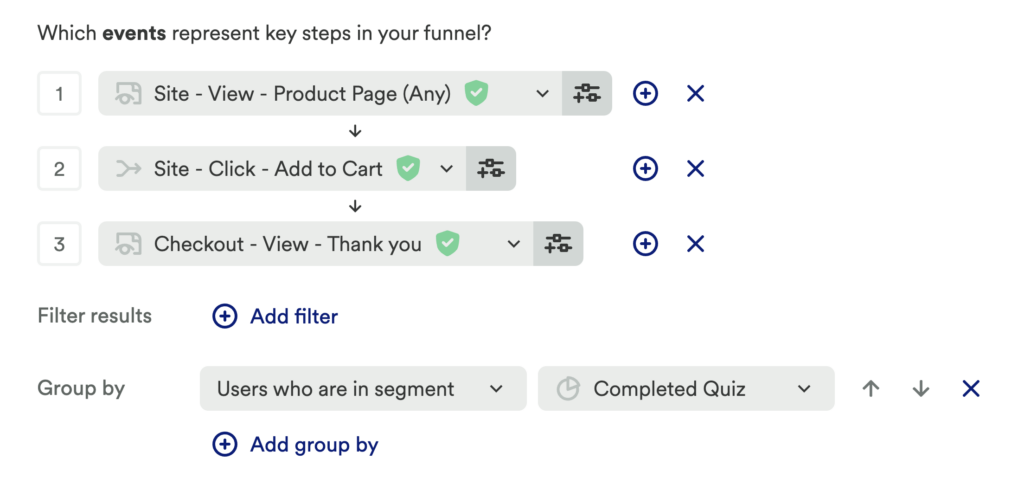
Next, set up a funnel chart and add each of your purchase steps as steps of the funnel. Be sure to group by Completed Quiz segment, or add a comparison of Segment A and Segment B of users.

What does this tell you?
This information helps you get a sense of how the quiz, or quiz variants, impacts purchase conversion. Do users who have completed a quiz have a higher conversion rate than those who haven’t?
If so, it shows that the quiz is effective in driving more purchases, and that it’s worth dedicating time to driving more users to it and making sure they complete it. If you are A/B testing different quizzes, this will also tell you which variant has a greater impact on your desired conversion event.
Chart 5: A/B Comparison chart: Funnel
Next, set up another funnel chart for each step in your quiz, with a comparison for Segment A and Segment B of users.
What does this tell you?
Examine baselines and draw a hypothesis. For example, is there significant drop-off between Steps 2 and 3 of the quiz? This is an opportunity for us to experiment/optimize this step.
Comparing your different quiz variants allows you to see the success rate of each version and determine if your A/B test increased the completion rate as you’d hoped.
Step 5: Interpret your results and take action
Take a look at your chart data. Is purchase conversion higher for those users who complete your quiz or form?
If yes, then you will want to continue optimizing the form by improving any points of drop-off that were discovered in the funnel analysis, as well as making your quiz more discoverable. Continue digging into analysis to understand if any marketing efforts have had an impact on completion success, or if there are any other actions successful purchasers take before completing the quiz.
If no, then you will want to continue optimizing your form completion by digging deeper into drop-off points, analyzing what users are doing instead of your quiz, and running some A/B tests, if you have not already done so.
For those who analyzed quiz variations via A/B testing, which one had a higher success rate for completion? Did that same variation result in higher purchase conversions?
If yes, use the successful variant and continue creating hypotheses to test and optimize your funnel even more!
If no, then you will want to unpack the test correlated with higher purchase conversion. Questions like, “why are users not starting or completing the quiz,” are a great start here!
Conclusion
Ensure your customers have a quality purchase experience by optimizing any forms or quizzes that they might fill out can go a long way in customer delight, retention and lifetime value.