To make the most of this guide, you’ll need a baseline understanding of key concepts like events, charts, and properties. If you are still learning about Heap (meaning those terms don’t mean anything to you), we recommend taking our Hello Heap course or reviewing our Setting Up Heap guide prior to jumping into this guide.
Introduction
We often hear, “Outside of my core , my site has a lot of interactive elements and I need direction in knowing what to define first.”
Have no fear, Heap is here! Heap provides you with the ability to know what users are interacting with the most, without having to define everything – giving you the power to define with intention in your own Heap account.
If you’re new to analysis in Heap, we recommend reviewing Create Your First Chart, which covers helpful charts 101 info.
Step 1: Define a generic “Click any Element” event
First things first: head into your account and use the wildcard (*) as your CSS selector to define a generic click event!
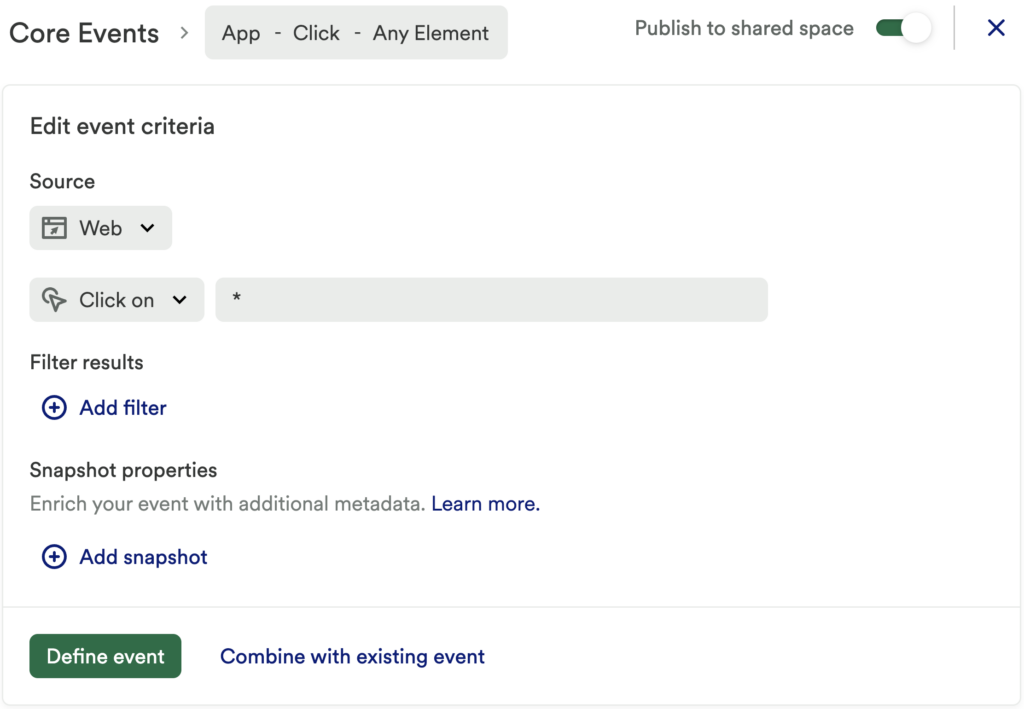
*You will want to be sure Heap Redact is not set up in your account – this prevents text from being picked up by Heap and is used for privacy and security purposes.
Step 2: Uncover your most used elements that haven’t been defined!
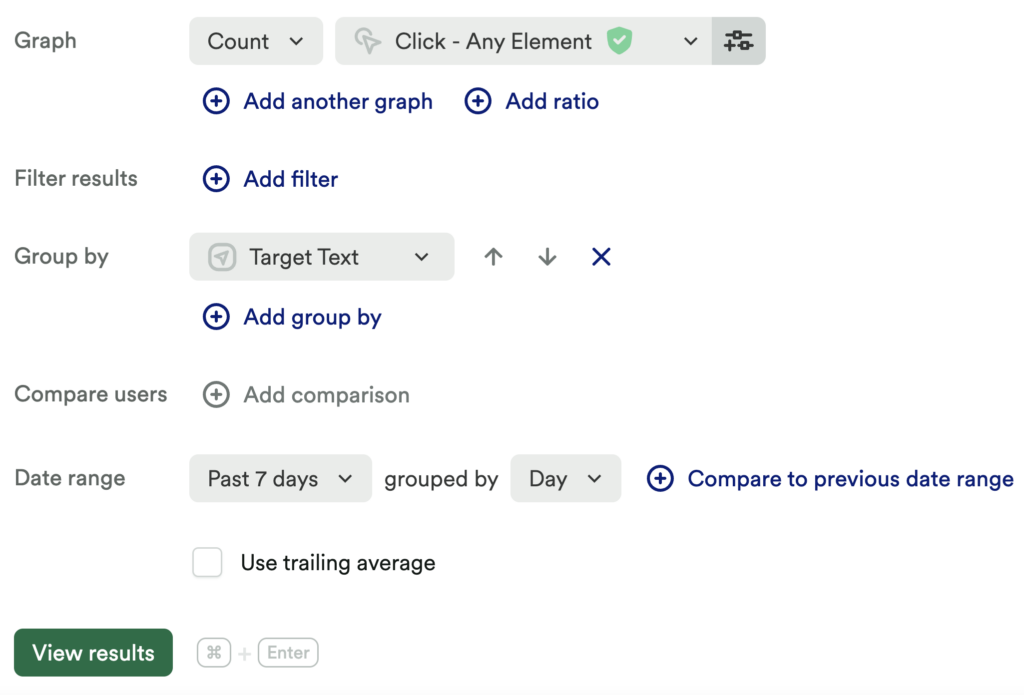
Chart 1: What elements are clicked on the most?
Set up a usage over time chart to measure a count of Click – Any Element, and group by Target Text.
What does this tell you?
If you head into the “table” view, you can organize this list by the total and see clearly which elements have the highest, and lowest, number of interactions. This can be a great starting point to help you identify your top 10 or 20 events.
Additional ‘Group By’ Suggestions
For anyone who is comfortable with CSS selectors and the code on their site, we recommend grouping by “target class” and “target ID” as well. This is because not all elements might have “target text” available. These additional properties give you a little more flexibility when analyzing interactions on your website.
Step 3: Define top events from the previous chart
Using the above chart, start defining more elements on your site based on what has been interacted with the most.
Are you seeing single-button clicks? Define them! Are you seeing elements that indicate the start of a flow, like “Open Template,” “Click Sizing Guide” or “Open Resources?” Great! Define those elements/interactions, and a few elements within the flow, like “customize template,” size guide interactions”, or viewing your most popular resources.
Step 4: Define the top events that have the greatest impact on a conversion or activation event(s)
Identifying a few key conversion or activation events to focus on will ultimately help you narrow your focus and give you direction as you begin building your queries, but this can be helpful when determining additional events to define.
Often, a conversion event is a one-time event, such as “sign up,” “submit order,” “request a demo,” or “learn more.” Alternatively, activation is when users find that ‘ah-ha’ moment.
Your aha moment is a metric that happens early on, is done quickly, and which shows that users are starting to get value out of your tool.
A few examples to help guide you:
- Adding 7 friends in 10 days on Facebook
- Following 30 users in 7 days on Twitter
- Getting your question answered in Quora
This will be different in every product, so it’s important to figure out what yours is so you can monitor it in Heap.
We will use a single “conversion event” to narrow our focus in this guide.
Chart 2: Discover what users are interacting with leading into conversion event
Set up a journey chart and add a minimum of pageviews > your Conversion Event. We recommend adding additional steps based on your expected journey. For example, if you have a signup flow, add those steps.
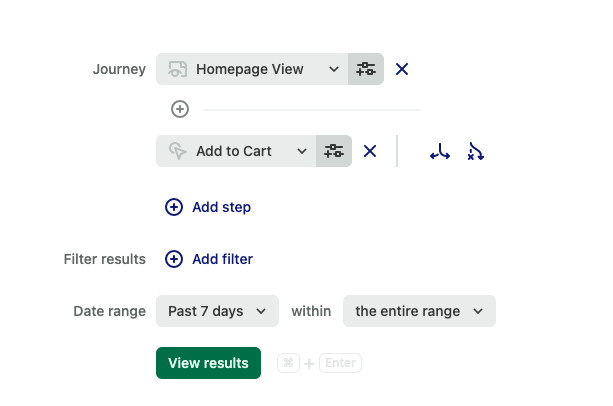
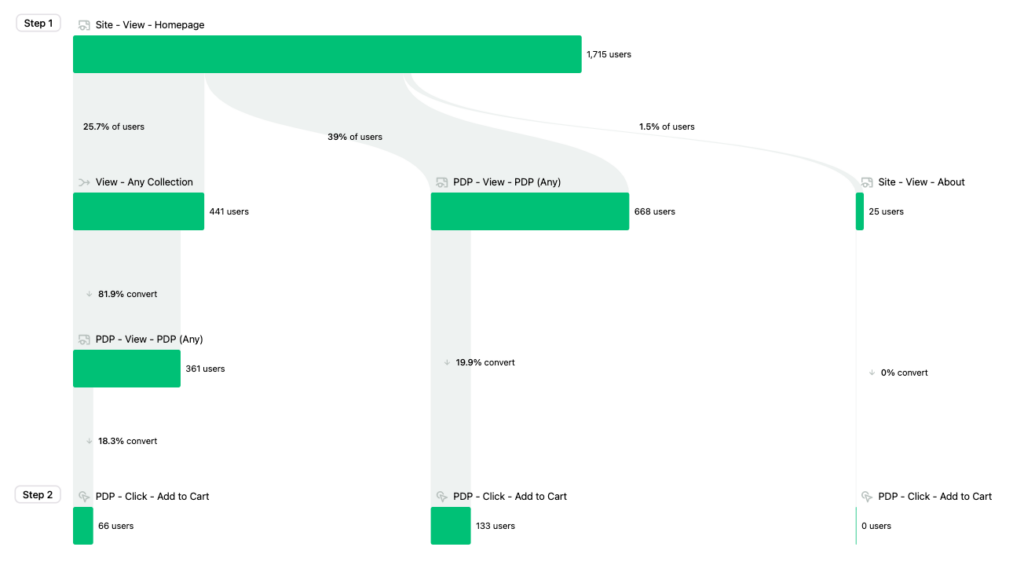
What does this tell you?
This chart can help you determine if you still need to define more events or what alternative journeys your users are taking – if you see the same event repeated in multiple steps, you will want to define more events from that particular page to see which element users are interacting with.
Step 5: Interpret your results and take action
The above steps allow you to identify your most-interacted-with elements so you can define the right things, not the things you assume should be defined. This direction can save you time and effort as you continue building out your Heap account. Plus, knowing what users are clicking on can help you organize your site for a cleaner experience, especially if you’re surprised by what your customers are interacting with the most!
We recommend going through this process at a consistent cadence, or any time your site has any changes made.
Conclusion
With Heap’s concept of autocaptured data, you don’t need to define everything on your site. Let Heap help you identify the most engaged-with elements so you can spend your time finding useful insights instead of defining things.