To make the most of this guide, you’ll need a baseline understanding of key concepts like events, charts, and properties. If you are still learning about Heap (meaning those terms don’t mean anything to you), we recommend taking our Hello Heap course or reviewing our Setting Up Heap guide prior to jumping into this guide.
Introduction
Different user verticals require different approaches when it comes to each step of the lifecycle. Heap can provide a deep dive that empowers you with a deeper understanding of your own user verticals, and their individual drivers for retention.
If you’re new to analysis in Heap, we recommend reviewing Create Your First Chart, which covers helpful charts 101 info.
Step 1: Capture ‘Vertical’ as a user property
To better understand how your verticals are performing, you’ll first need to make sure that Heap is capturing the data. Since it is often unique based on your business, ‘Vertical’ is not an autocaptured property and will need to be set up for your account. This can be done via integration with one of our native sources, or via custom API track calls.
Step 2: Determine what active usage means for your team
What action or actions are you expecting your users to take to indicate they are truly using the tool? How often are you expecting your users to interact with the feature or features? This step is often overlooked, but setting this standard for the team will ensure everyone is taking the correct approach when identifying ‘Active’ customers.
View Home Dashboard, Download to CSV, Add to Cart, or even interaction with a particular feature are all common events to consider. Setting the cadence in which users should be interacting with your events can vary greatly depending on your site or app. Collaboration tools might be used on a daily basis, whereas HR tools might be heavily used on a quarterly basis. Take a moment to think about the cadences you are expecting but remember this is something you can always play around with!
Step 3: Determine which retention features you would like to monitor
Often, teams have clear indicators of retention, and expect to see their users interacting with specific parts of the site or app. This can be interacting with a page, a button, consistently logging in, and more. Start by identifying these features. This will help you narrow your focus and give you a list of items to compare.
Additionally, you will want to identify the specific event(s) that indicate usage of the feature(s). This will be your ‘Retention Usage Event’.
Step 4: Create appropriate Segments
If applicable, create segments of users who you expect to interact with your feature(s) at a higher volume.
For example, Admin users will interact with the Subscription Upgrade elements of a tool, whereas other team members may not interact with this information at all.
Alternatively, users who have not added an item to their cart will likely not click to view their cart, and users who don’t have access to a particular page will not have interacted with any elements on that page.
Step 5: Analyze!
Chart 1: Baseline query: active usage by vertical
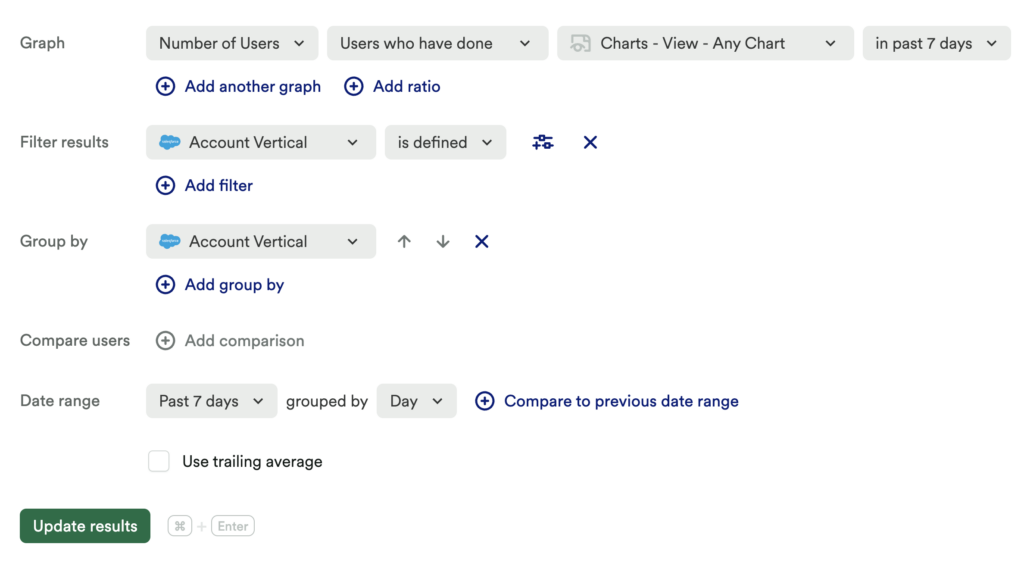
Set up a usage over time chart of the Number of Users > who have done > Retention Usage Event > in past 7 days (or by your preferred time range). Add a filter for vertical > is defined, and group by vertical.
What does this tell you?
This will tell you the total number of Active Users based on vertical.
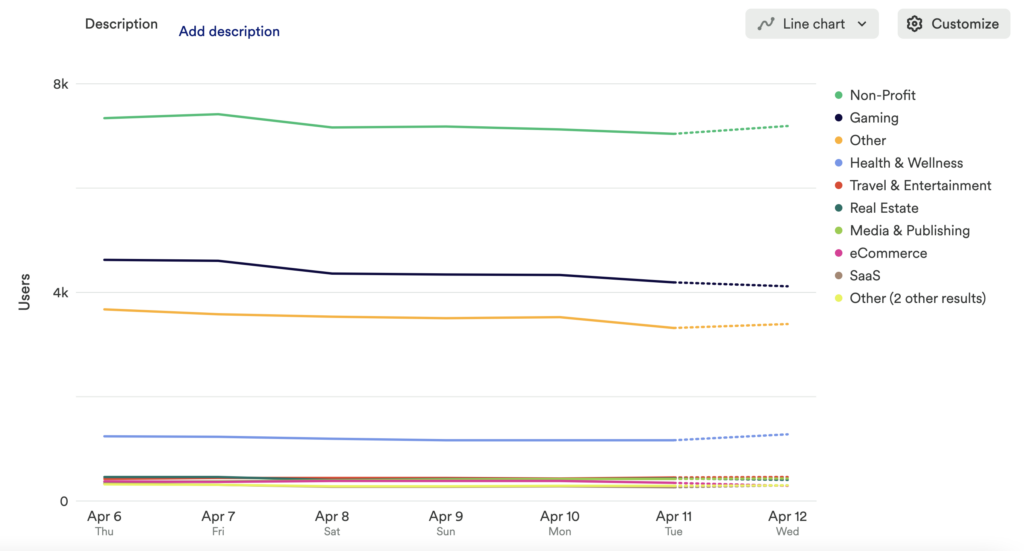
Click Add Comparison to see how usage has changed from your current time range to the previous one.
Chart 2: Retention feature usage by vertical
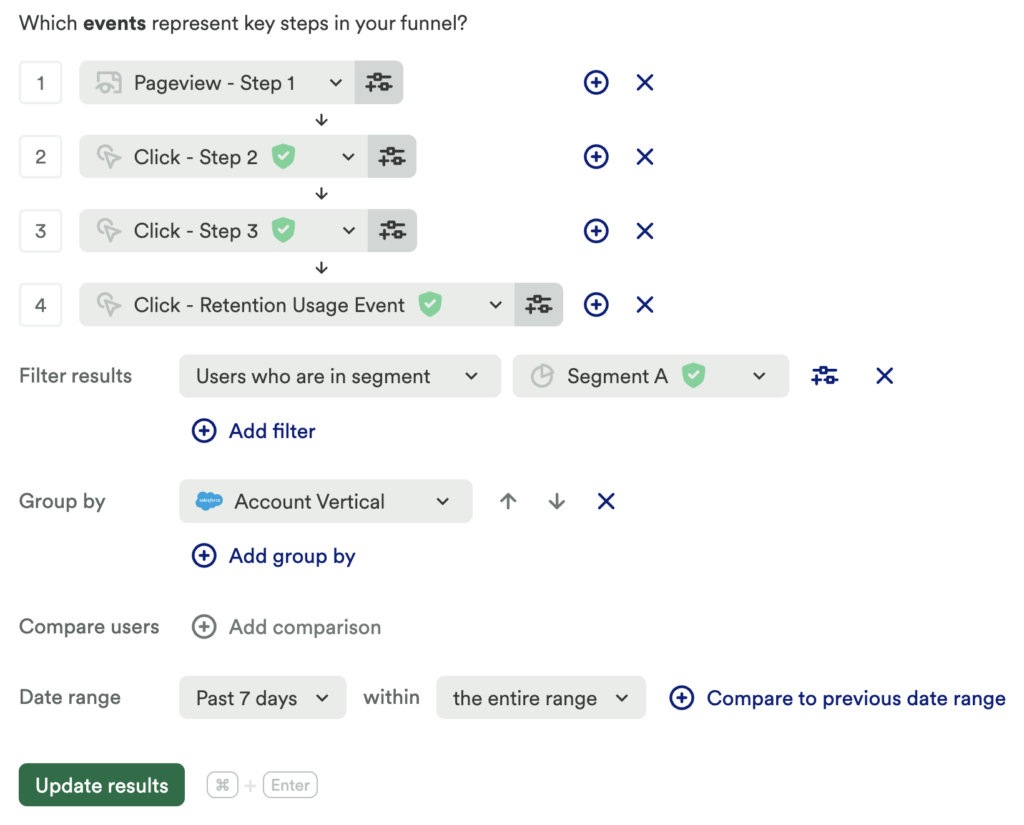
Next, set up a funnel chart for each step leading to your Retention Usage Event. Be sure to group by Vertical.
What does this tell you?
This will tell you the conversion rate of your desired retention feature(s) by vertical. Be sure to filter for any relevant segments!
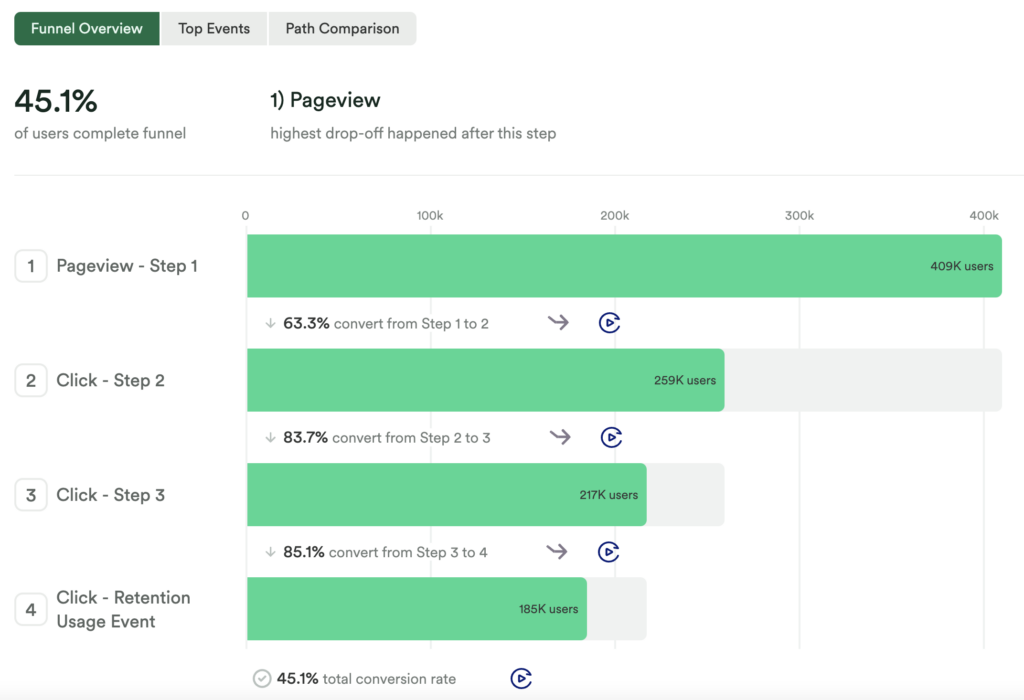
Chart 3: Ratio of retention feature usage
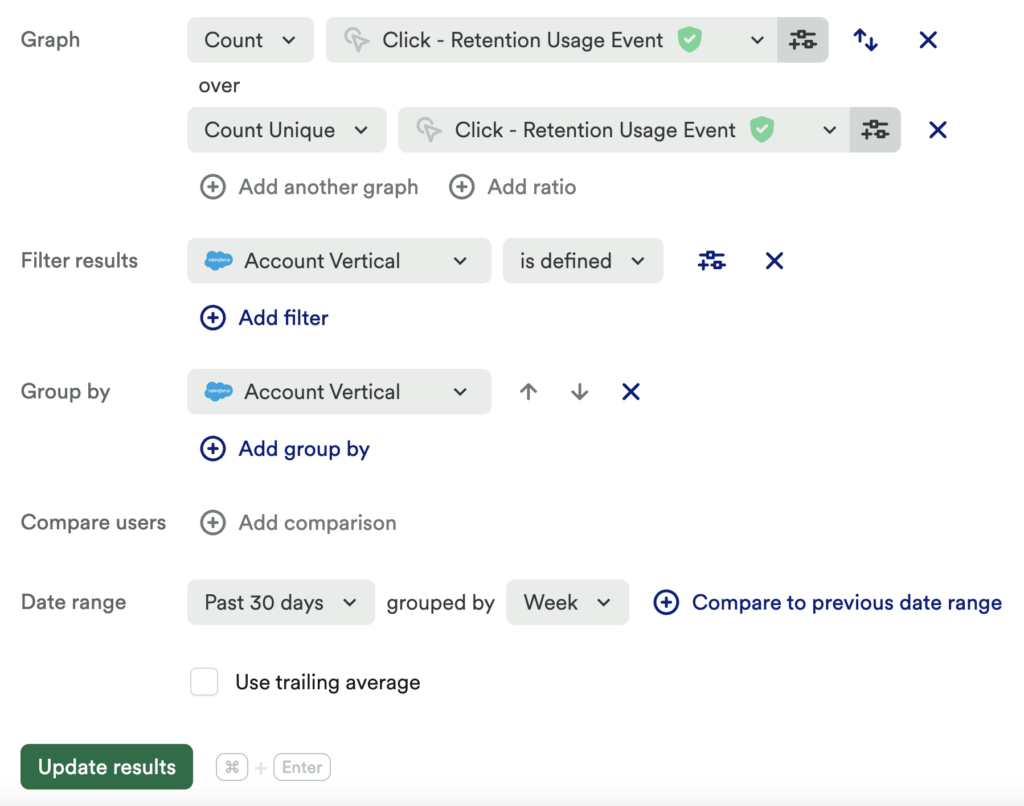
Set up another usage over time chart of a count of clicks on your Retention Usage Event. Use the + Add ratio button to add a count unique of the same Retention Usage Event. Add a filter for Vertical > is defined and group by Vertical.
What does this tell you?
Understanding the ratio of users who can complete your retention feature versus those who actually do complete your retention feature can be powerful. This provides a start to know if this feature is usable, and even can help you start to determine if it is useful.
Be sure to filter for any relevant segments!
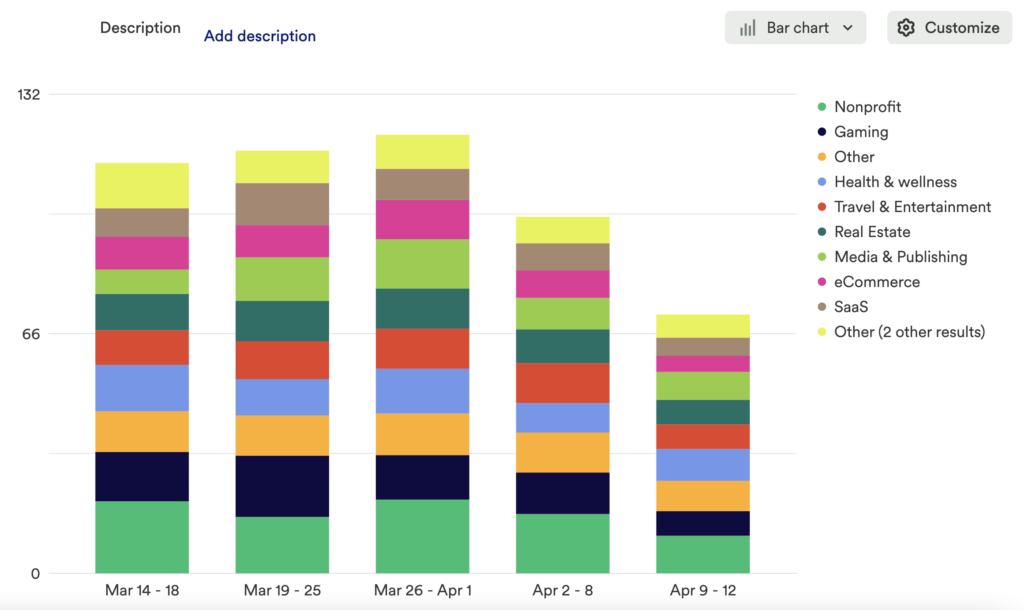
Chart 4: Retention of key actions by Vertical
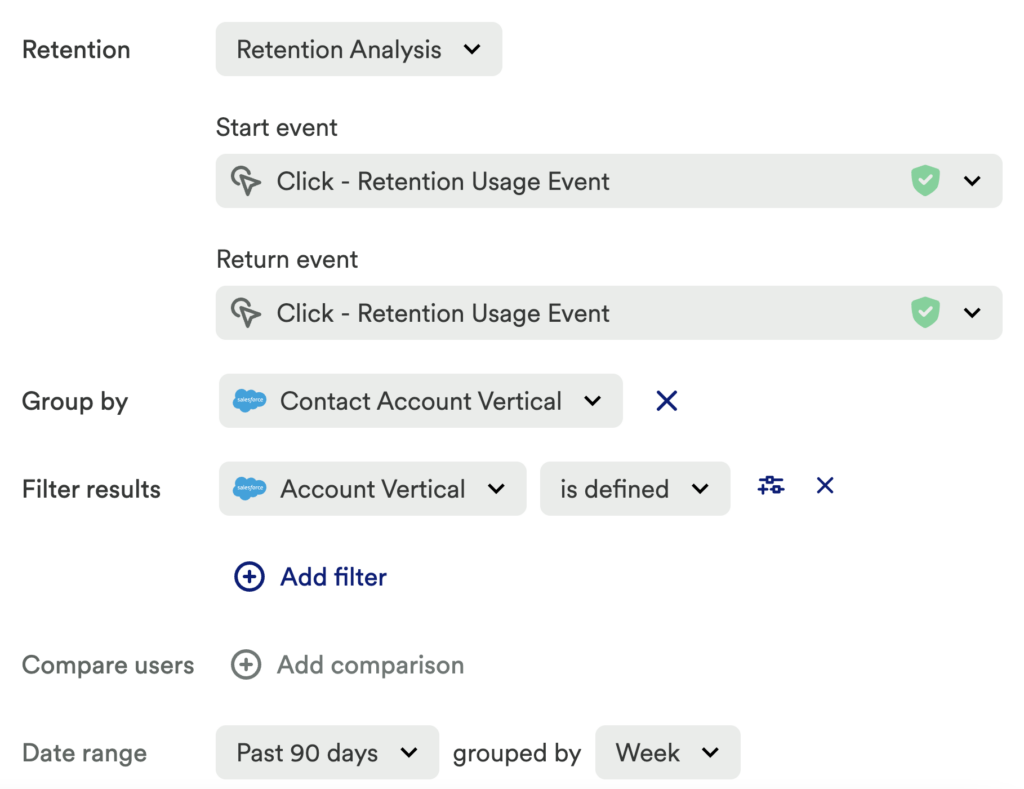
Last but not least, set up a retention chart. Set the following in this chart:
- Start Event: Any desired Retention Usage Event
- Return Event: Retention Usage Event or any desired usage event you wish to monitor
- Filter: Vertical is defined
- Group By: Vertical
What does this tell you?
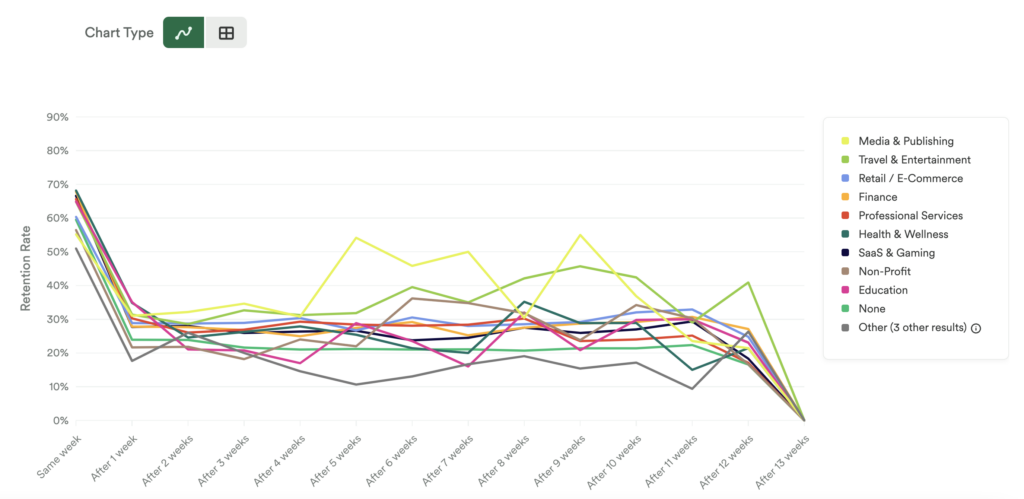
This will tell you which vertical has the highest retention rate for any key actions defined in Heap.
Step 6: Interpret your results and take action
Through these charts, you can figure out what drives your various verticals’ efforts. Gain insight into what content successful users gravitate towards, and focus your marketing efforts on delivering similar content. You can even encourage prospects to convert by gatekeeping high-volume resource materials, like blog posts or guides.
Conclusion
Knowing how different types of users interact with your product can help you to better tailor marketing campaigns or build new features that pertain to your higher-paying verticals.